Mastering Nagios XI: Setting Up and Configuring the Monitoring Tool
Nagios XI is a robust open-source monitoring tool that enables you to closely monitor your servers, services, and network devices.
The major Advantages of Nagios:
- Nagios reduces downtime by providing early warnings of potential issues, allowing proactive intervention before serious problems arise.
- It actively monitors the status of hosts and services at defined intervals, promptly detecting any issues for immediate action.
- Nagios offers comprehensive monitoring capabilities, including monitoring CPU usage, memory, disk space, network traffic, and more. This provides a thorough understanding of system health.
- It supports monitoring across various operating systems, applications, and network devices, making it suitable for heterogeneous environments with diverse technologies.
- Nagios allows for customizable alerts based on specific conditions. You can define thresholds for various metrics and configure notifications to be sent via email, SMS, or other communication channels.
Prerequisite:
- An AWS account with the necessary permissions to create and manage EC2 instances.
- Basic knowledge of AWS services and Linux commands.
- A registered domain (optional, for SSL certificate setup. We are using freenom for this demo).
Installation of Nagios XI
A) We will create an EC2 instance with EIP.
We will create an EC2 instance (I am using Ubuntu 20) with instance type t3a.medium (you need to choose the instance type based on your monitoring capacity (use the below-mentioned image for the consideration on which server spec to choose)
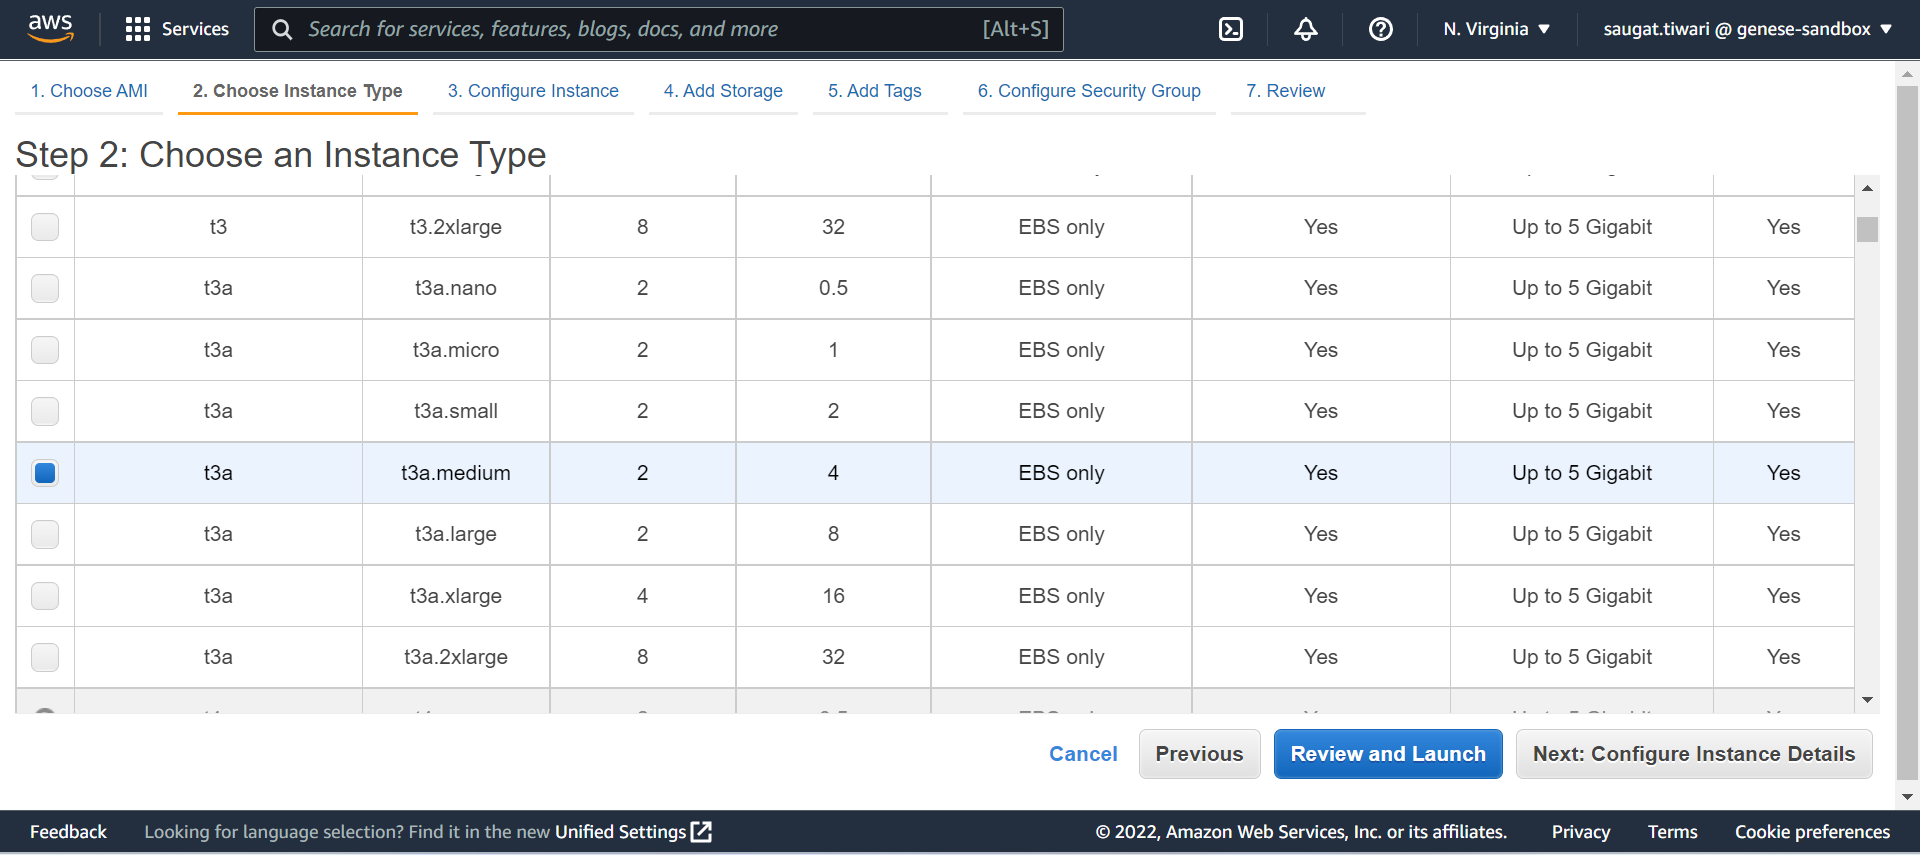
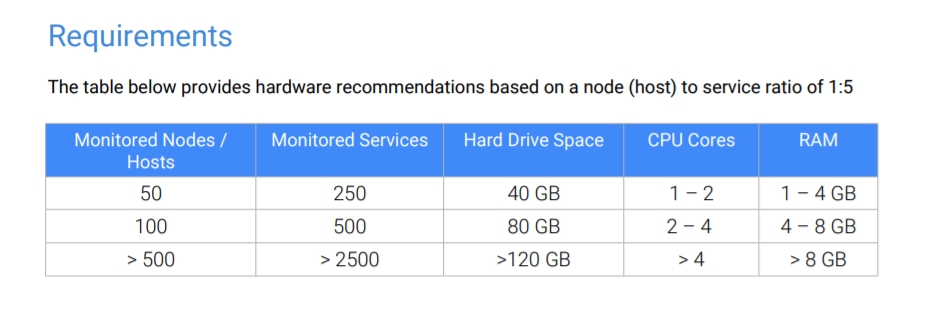
Choose the hardware spec of the server as per your requirement.
B) We will install Nagios XI.
- SSH into the (EC2) server. Update and upgrade the server.
sudo apt update
sudo apt upgrade
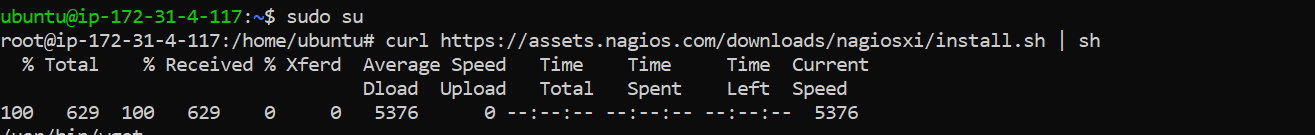
- Login into the server as root.
sudo su
- Hit the Quick installation command (you can also use the manual download option).
![https://assets.nagios.com/downloads/nagiosxi/docs/Installing-Nagios-XI-Manually-on-Linux.pdf]
curl https://assets.nagios.com/downloads/nagiosxi/install.sh | sh
Go have a cup of coffee, it will take around 30 minutes or less.
C) We will configure Nagios after its installation.
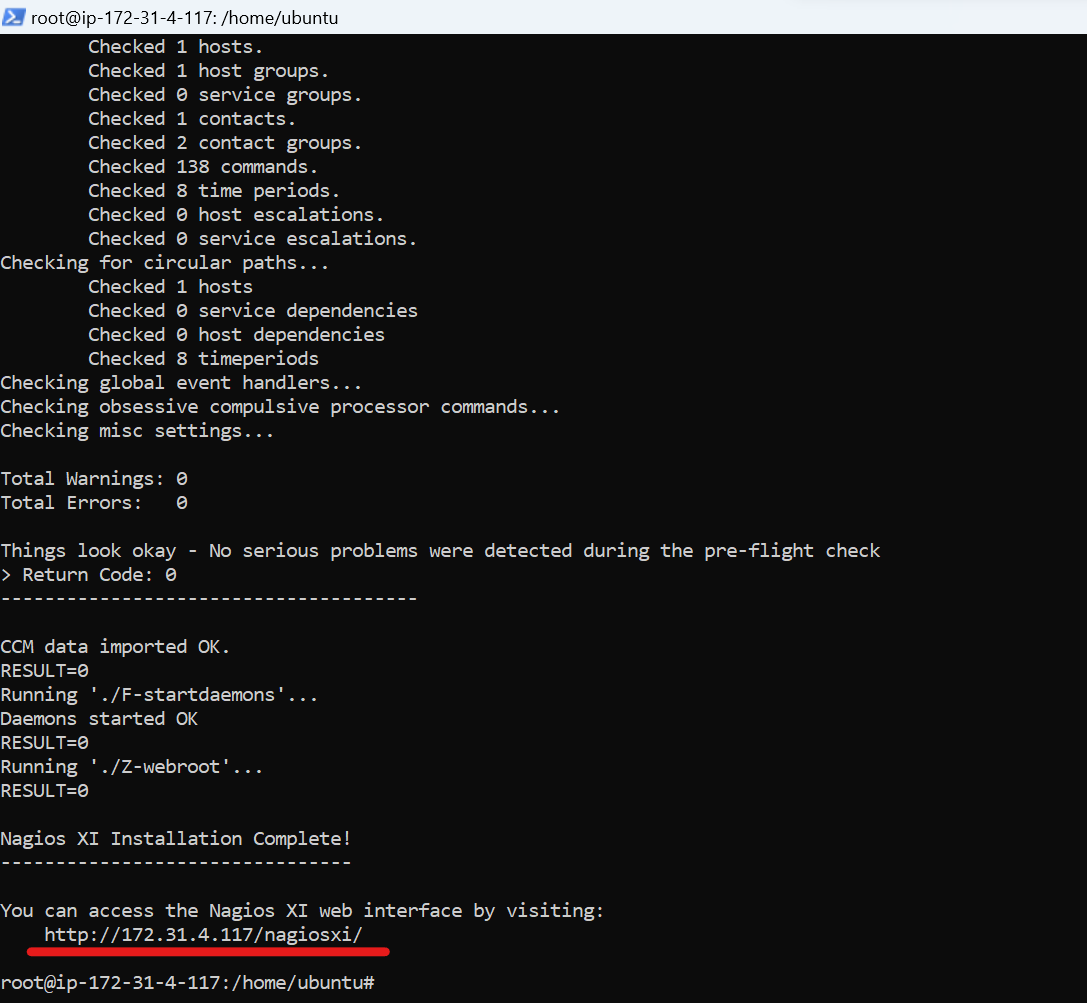
- Once the installation is completed, you will get a URL stating http://IP address/nagiosxi as shown in the image below.
http://public_IP_address/nagiosxi
Example:
http://34.200.255.19/nagiosxi in my case.
Access Nagios using the URL given after Nagios is installed.
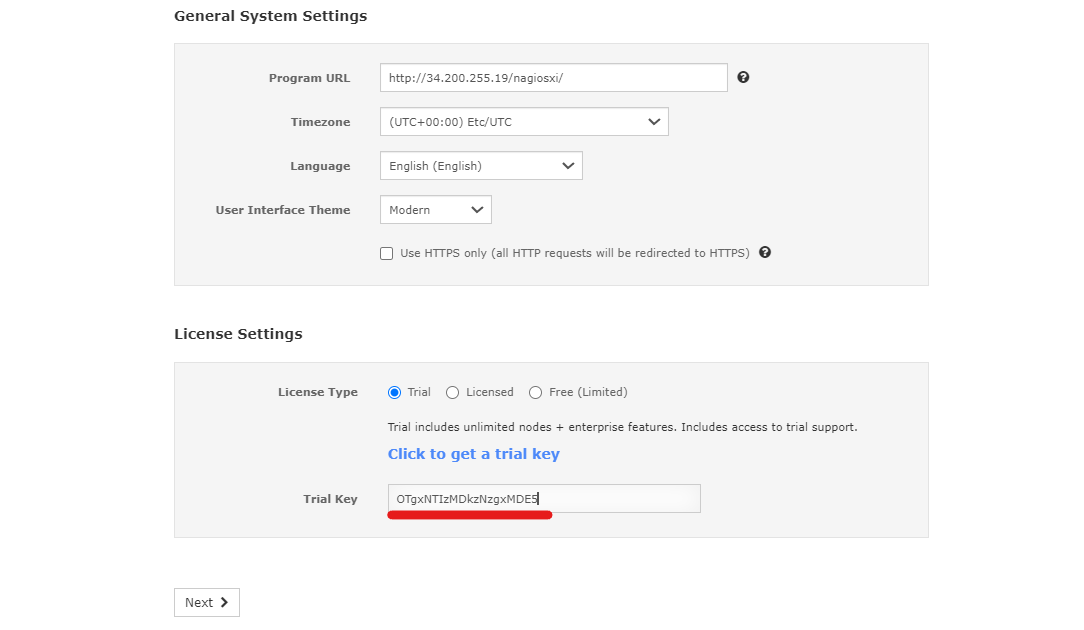
- Now you will see the page as shown below, where you can put the required details and also choose the License Packages. (For this demo I will be choosing the Trial plan).
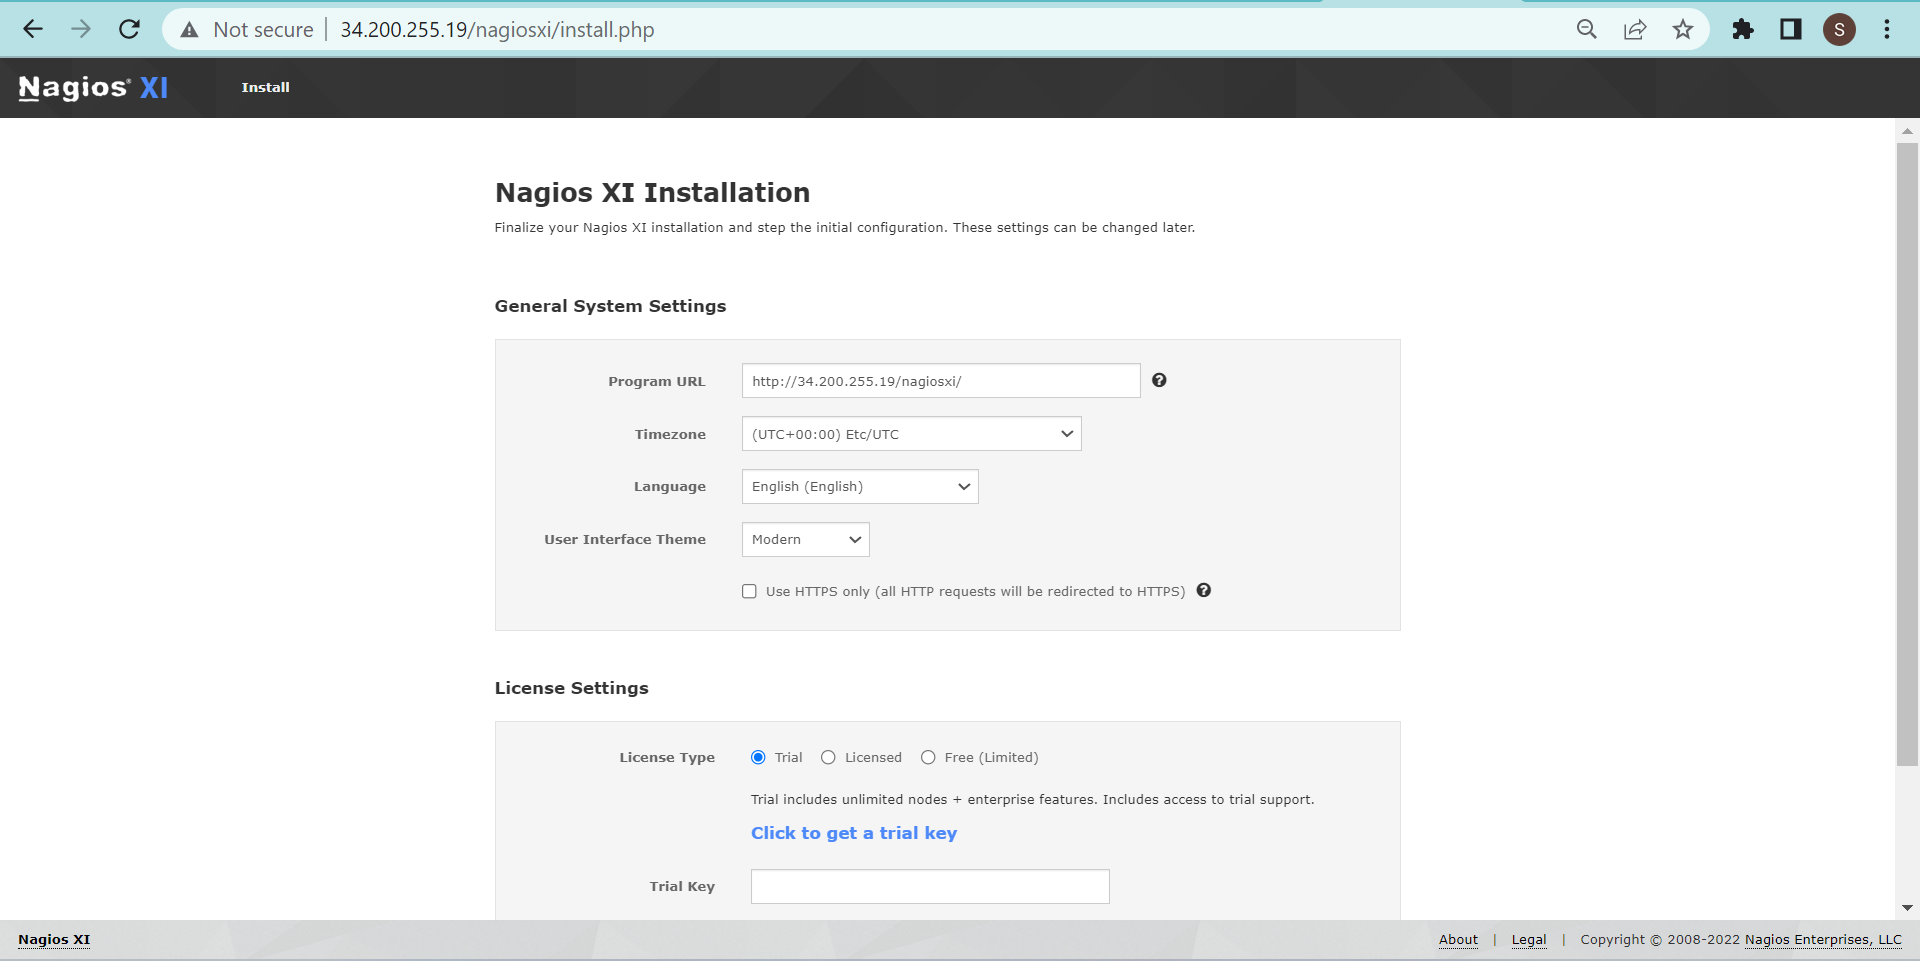
Choose the Right License plan as per your requirements.
- As I am choosing the Trial Plan, Once I click on “Click to get a trial key” I will be redirected to a page where I will have to push the Name and the email address where I want to get the Trial Key.
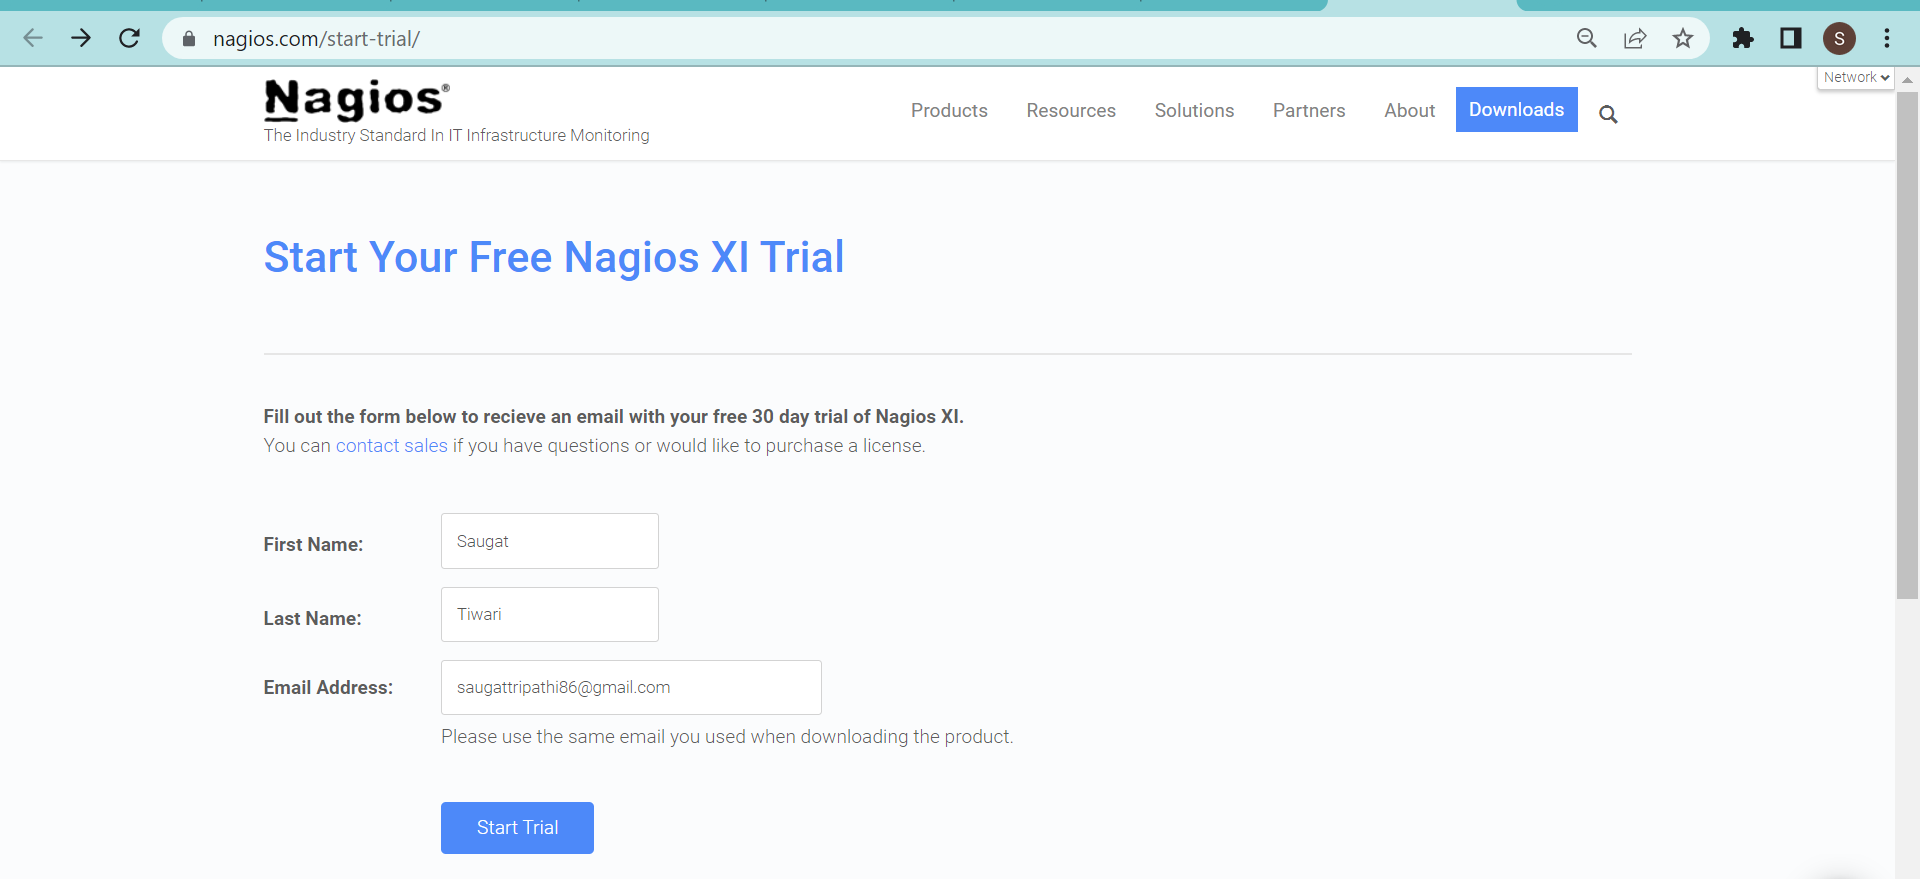
Push the Name and the Email Address where you want to get the Trial Key.
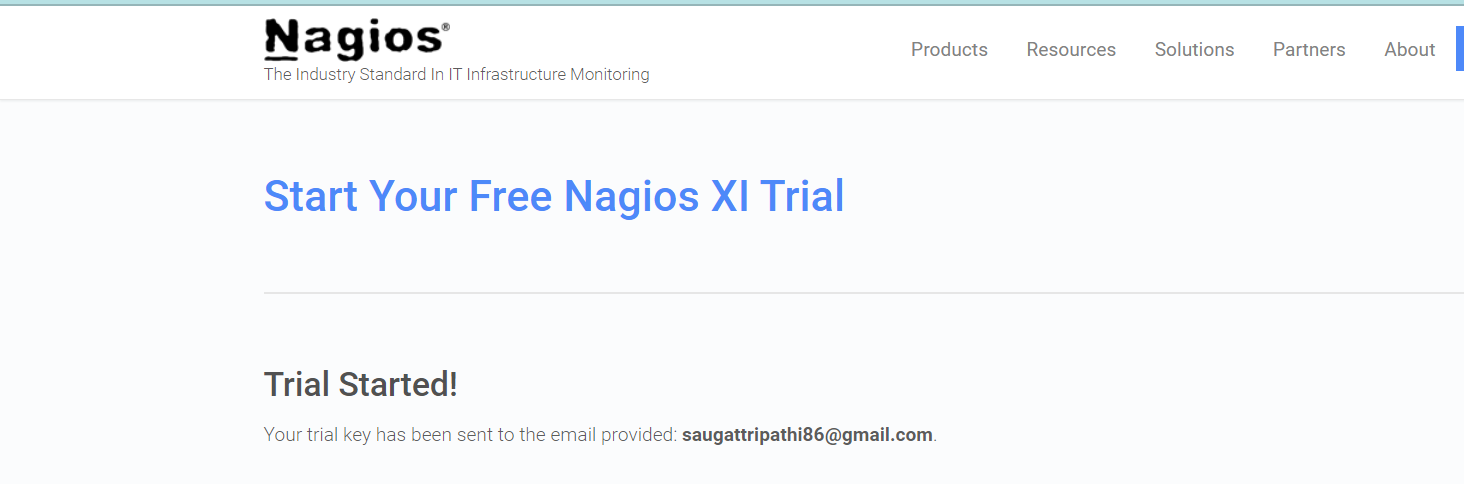
Message showing that the Trial Key has been sent.
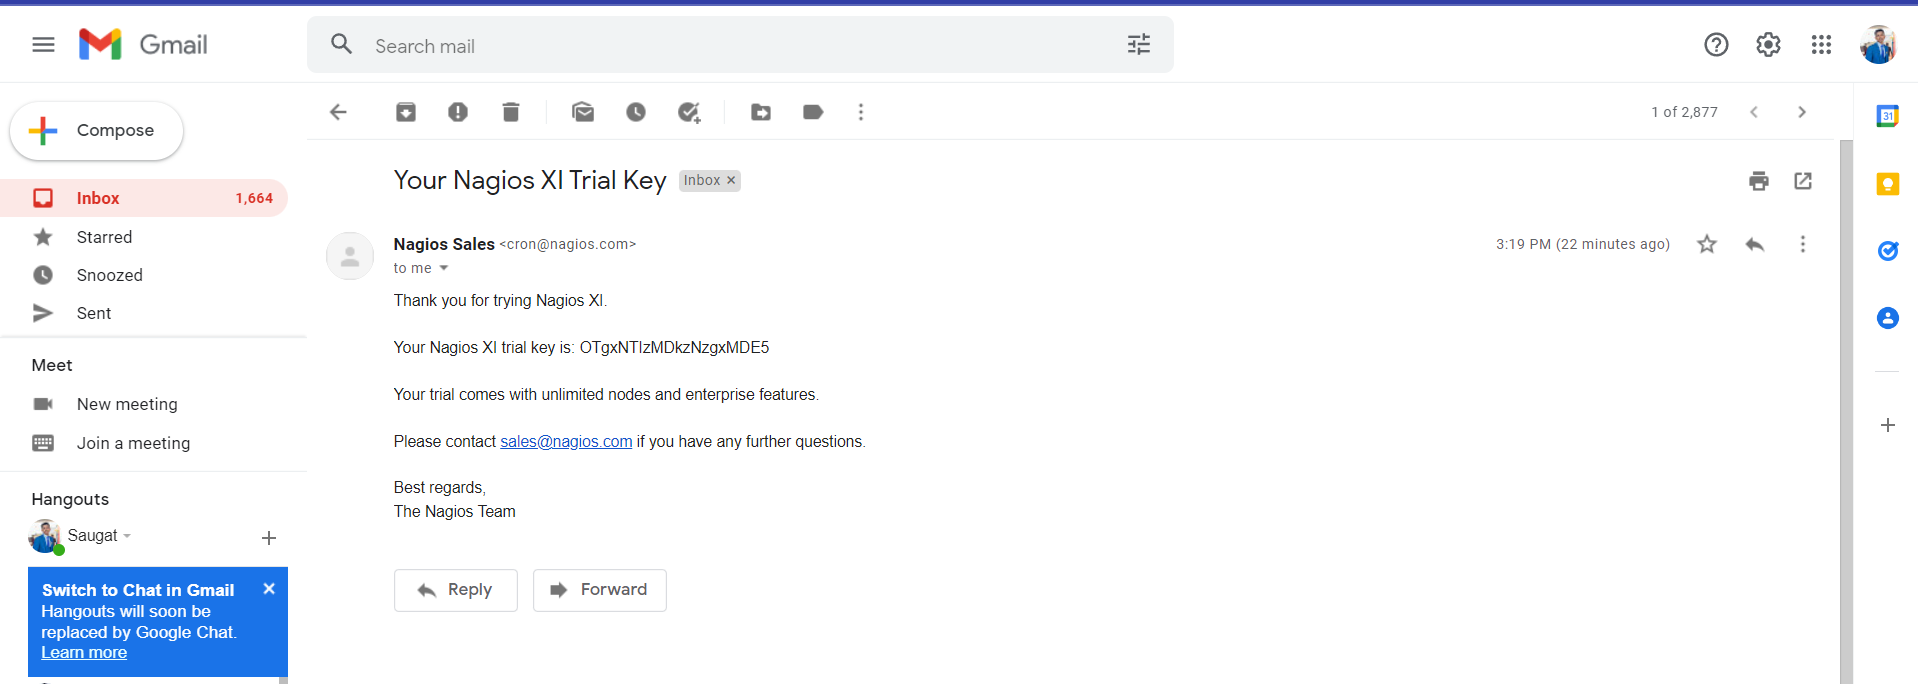
And, Nagios Trial Key is in your inbox.
- Once I get the Trial key I will Put that and click on Next.
- Push the details accordingly in the Admin Accounts Settings and then click on Finish Install to complete the final installation configuration process.
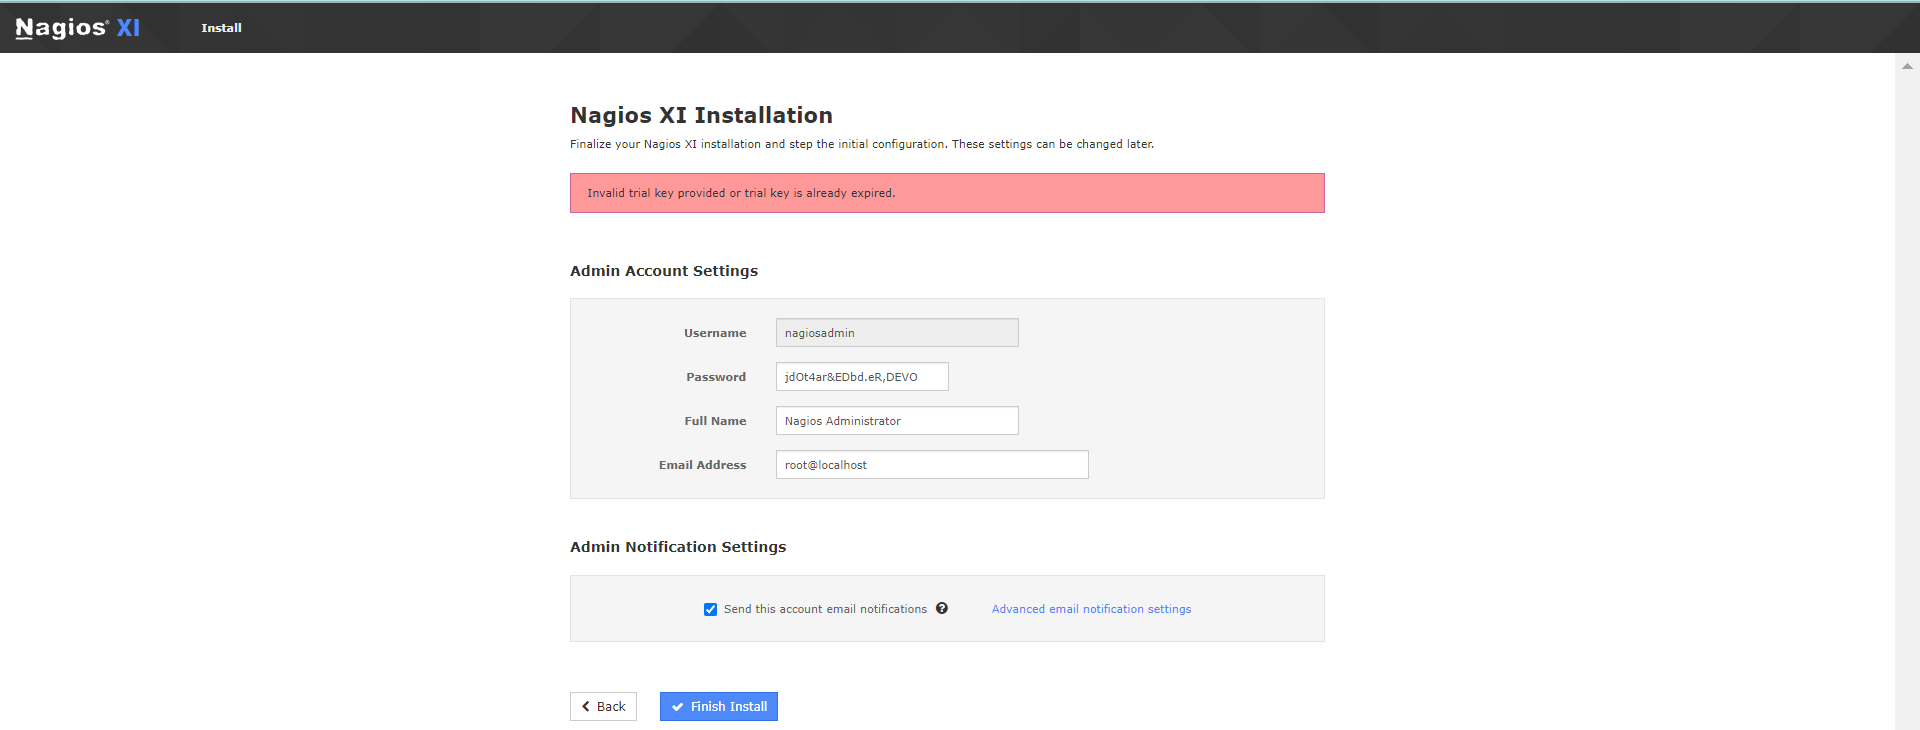
Fill the details accordingly in the Admin Accounts Settings and then click on Finish Install.
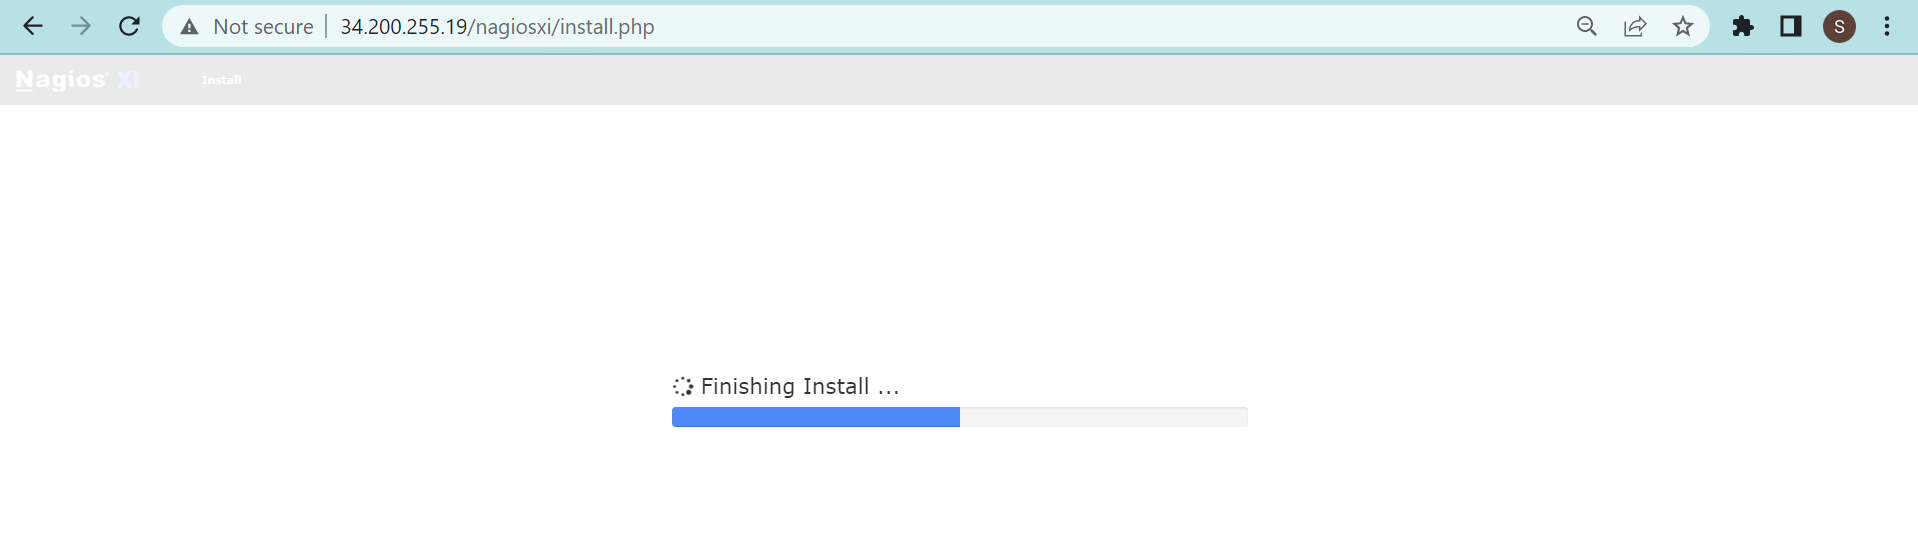
Final Nagios installation in progress.
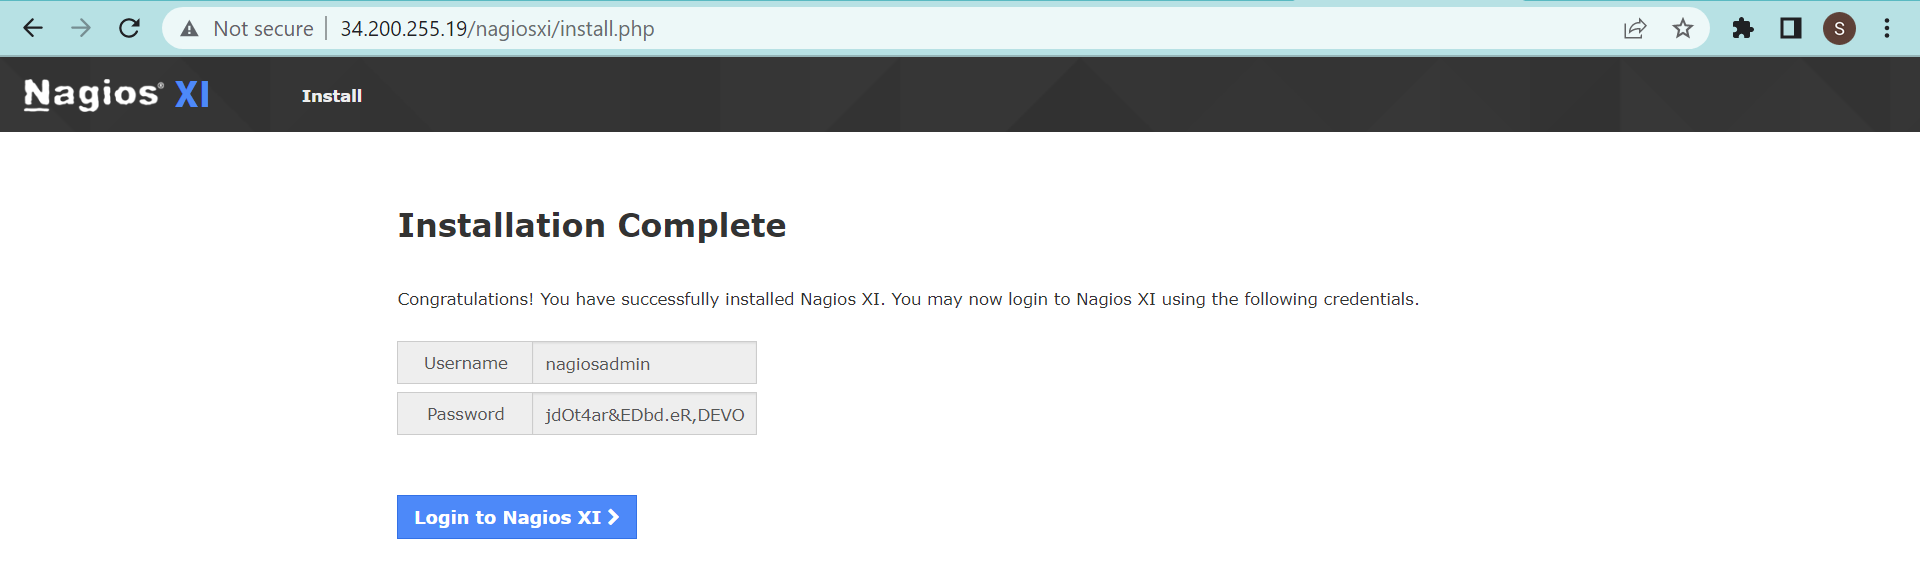
Username: nagiosadmin
Password: jdOt4ar&EDbd.eR,DEVO
Installation is complete with the username and password on the screen.
- Login into the Nagios XI using the username and password configured before.
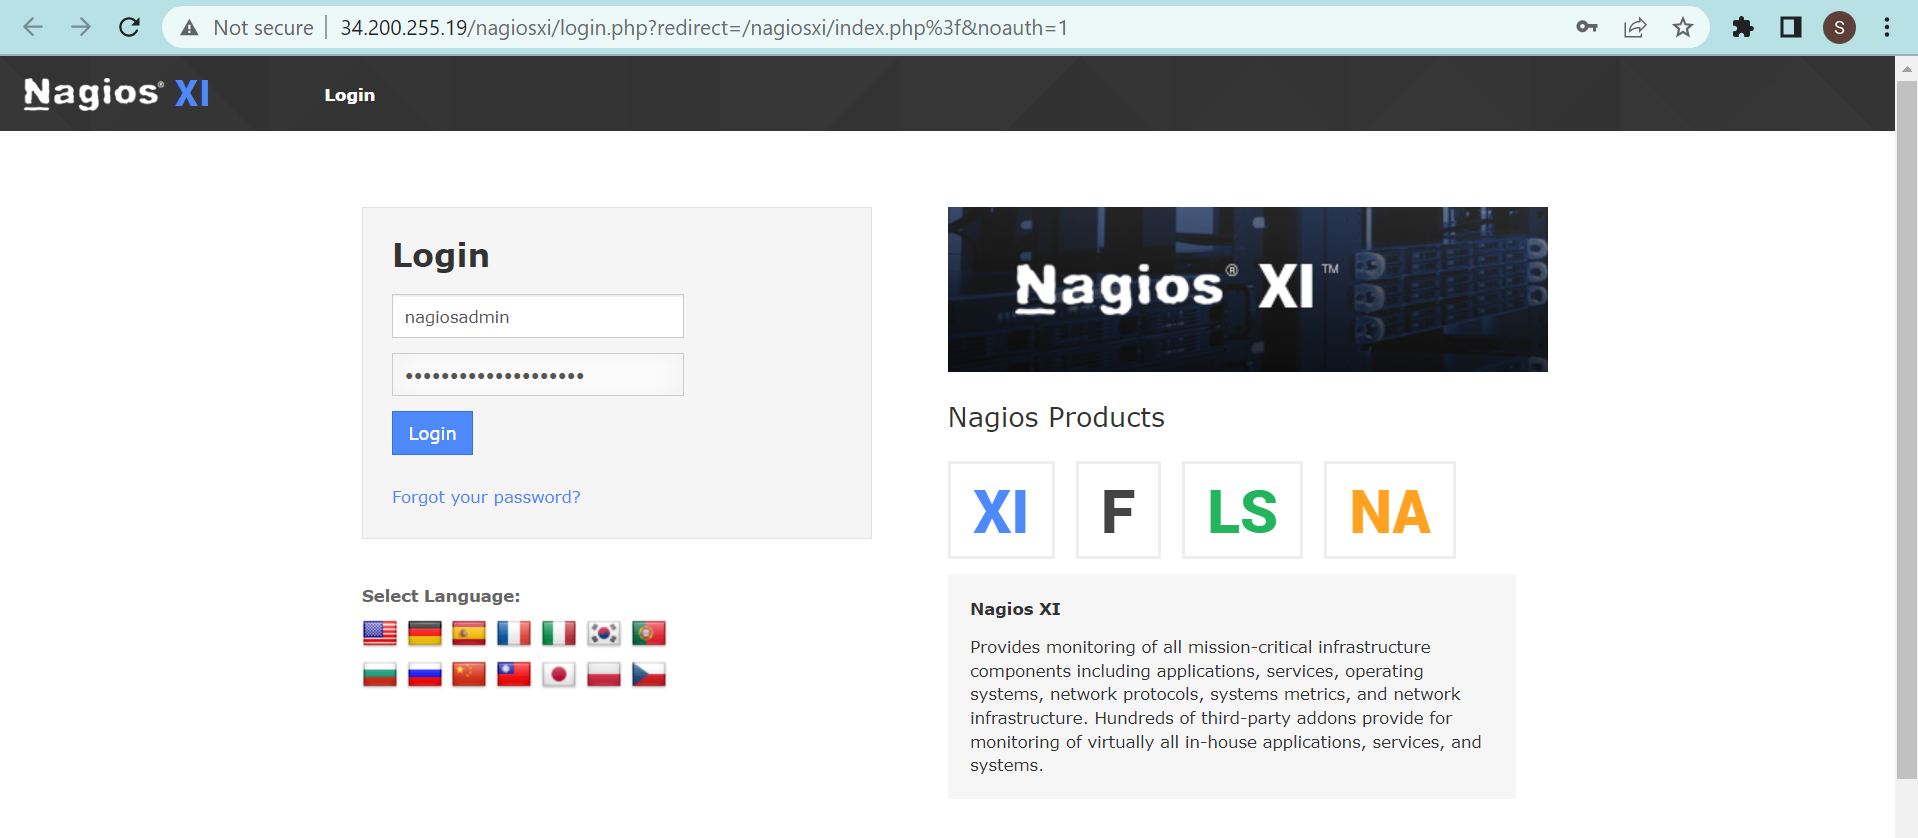
Login page of Nagios XI
Congratulations! The installation of Nagios XI has been completed successfully.
Configurations and Testing
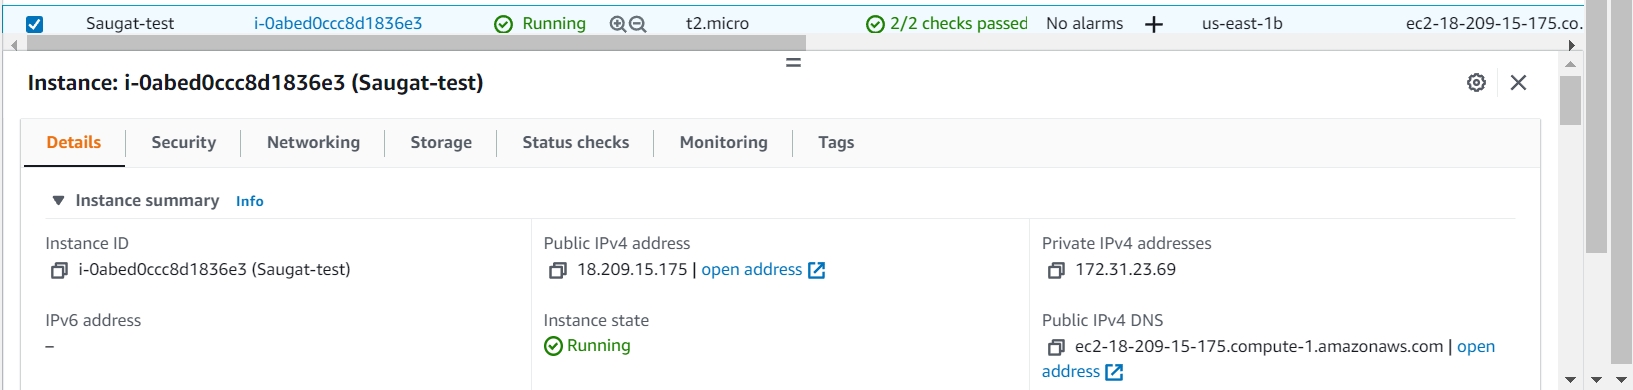
To begin, let’s create another EC2 instance to host a simple static site. We will then add SSL using certbot and configure the domain for this static site. This will allow us to test Nagios XI configurations and its features.
For this testing purpose, I have already created the following EC2 instance:
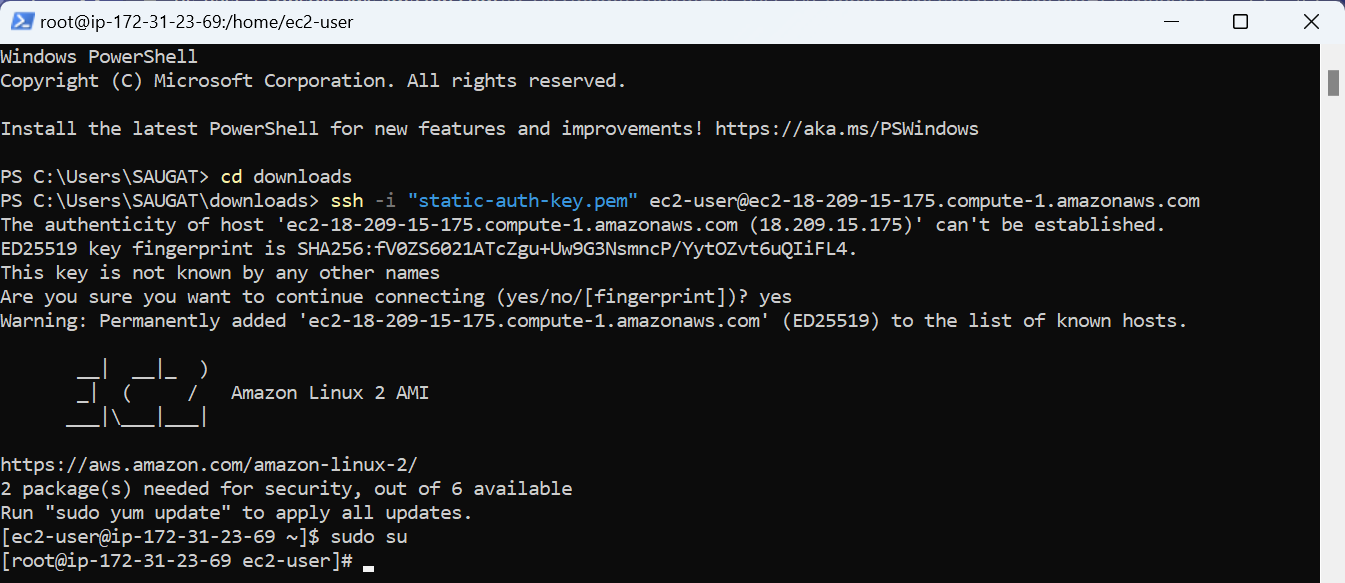
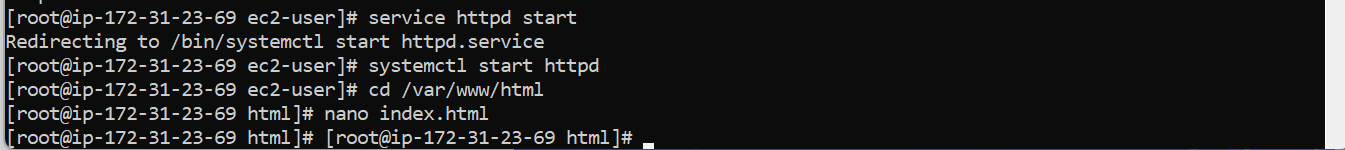
And, lets ssh into this EC2 instance:
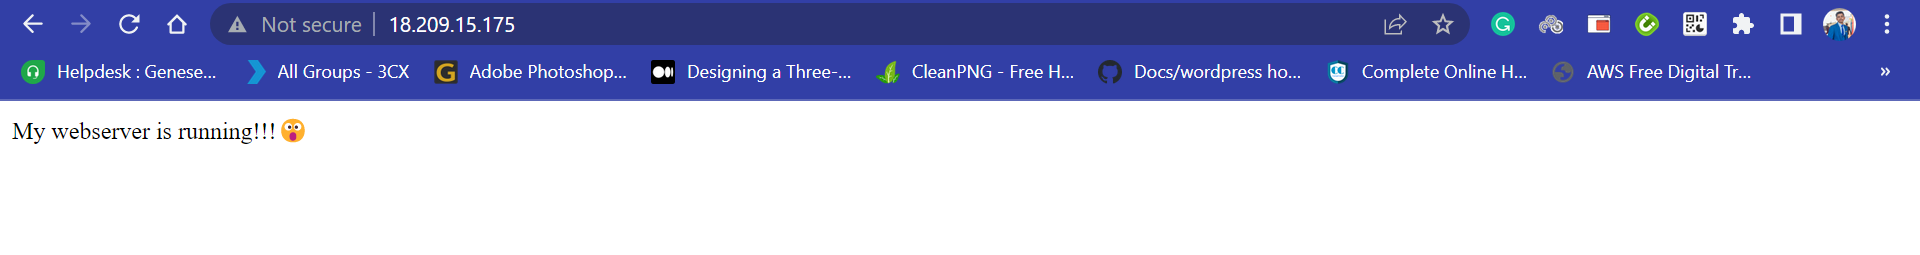
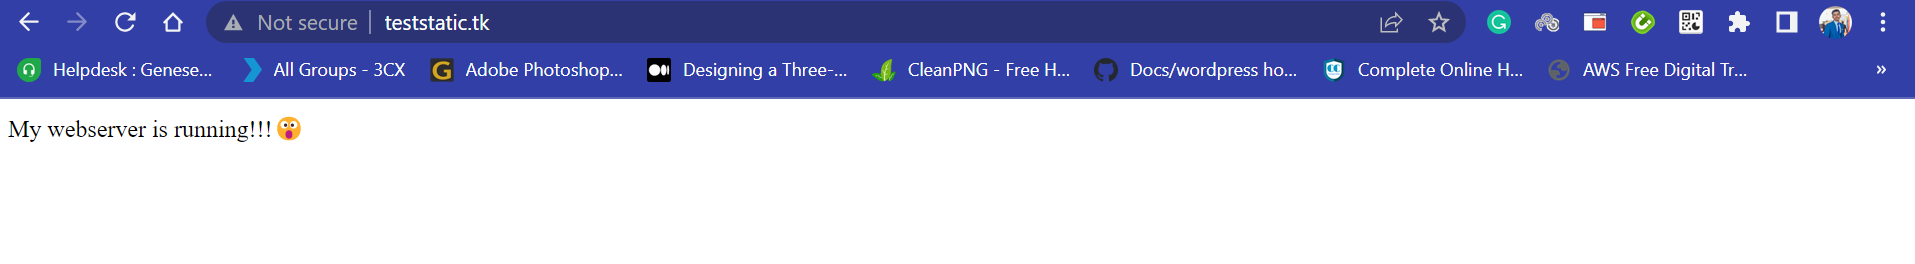
Lets create index.html file inside html directory with My webserver is running!!!😲 content:
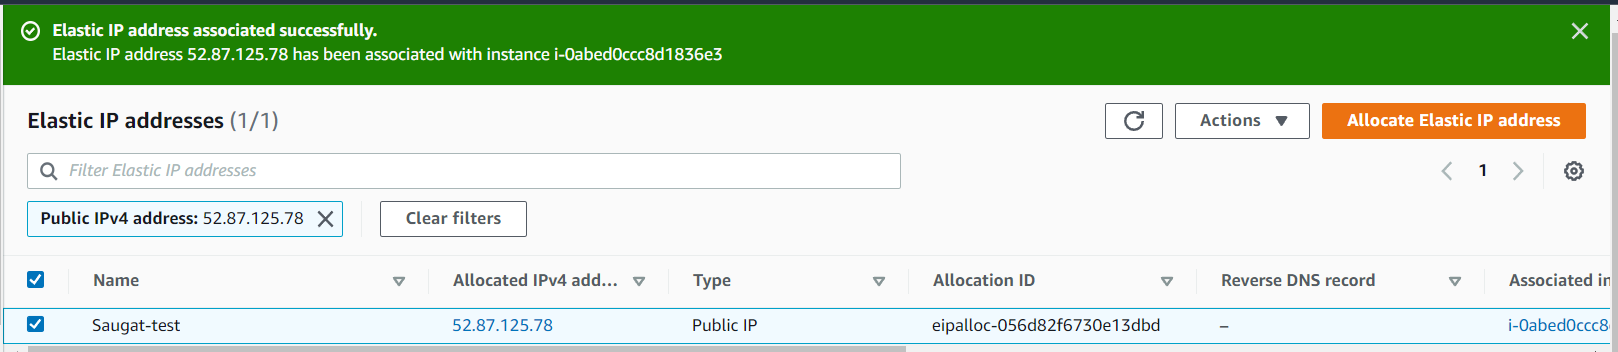
Now, associate elastic Ip.
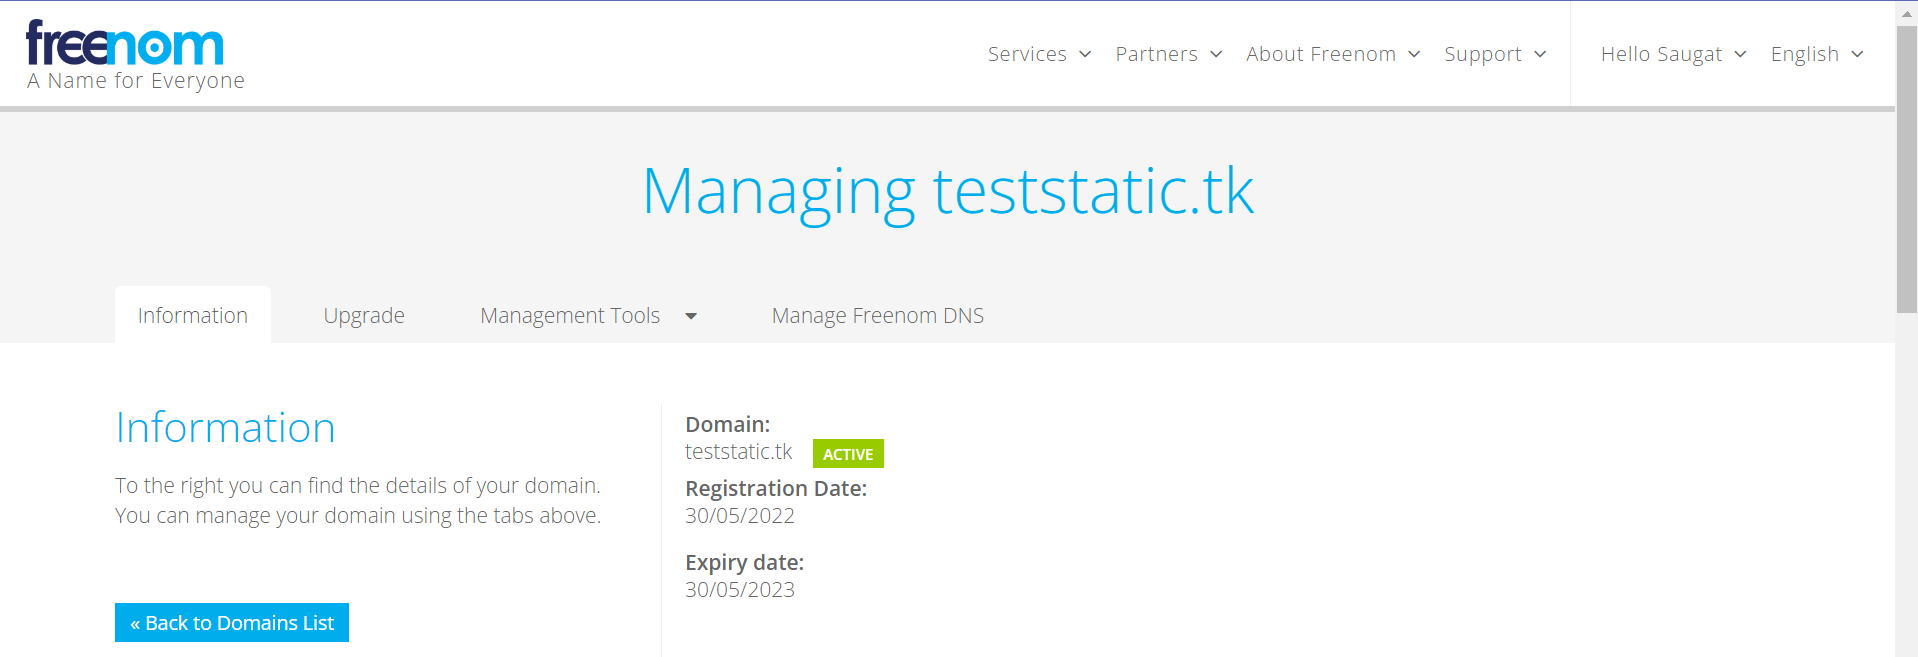
Register the domain in freenom.
To add an SSL certificate using certbot, run the following commands:
sudo nano /etc/httpd/conf/httpd.conf
<VirtualHost *:80>
DocumentRoot "/var/www/html"
ServerName "teststatic.tk"
ServerAlias "www.teststatic.tk"
</VirtualHost>
sudo systemctl restart httpd
sudo amazon-linux-extras install epel -y
sudo yum install -y certbot python2-certbot-apache
sudo certbot
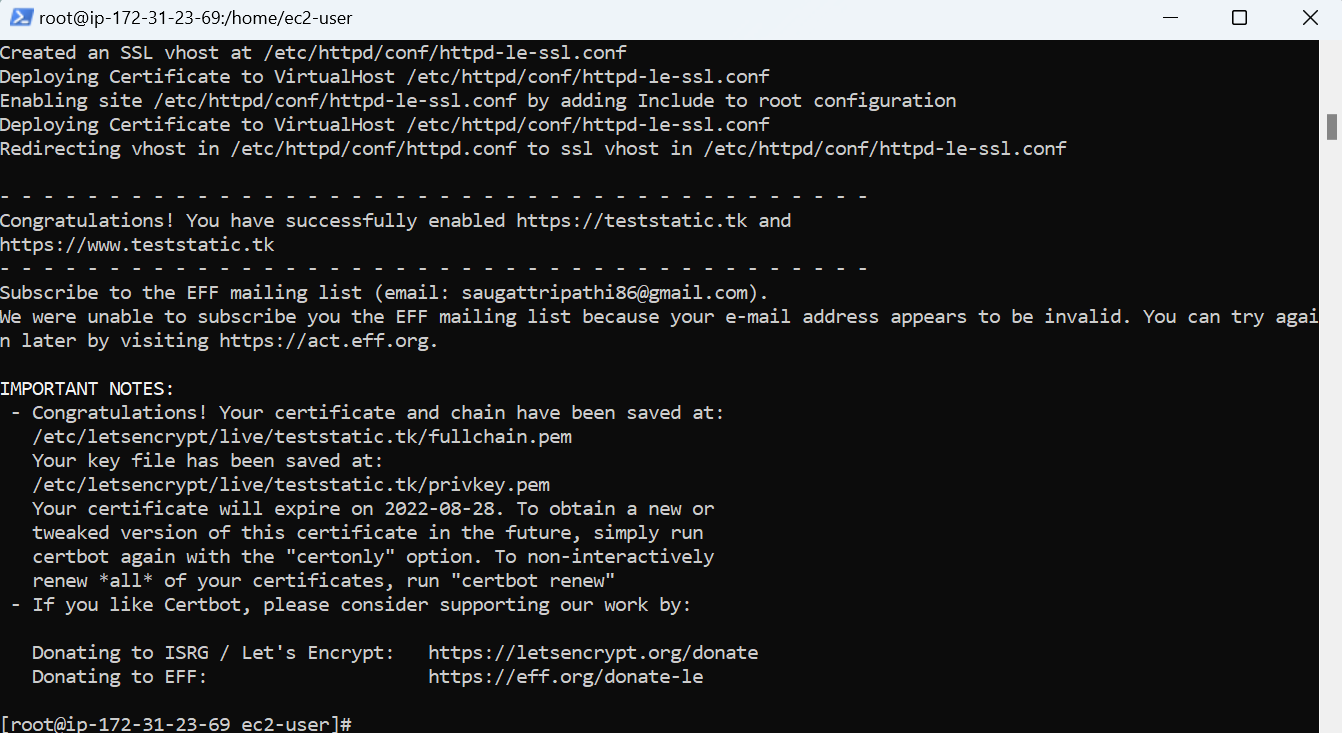
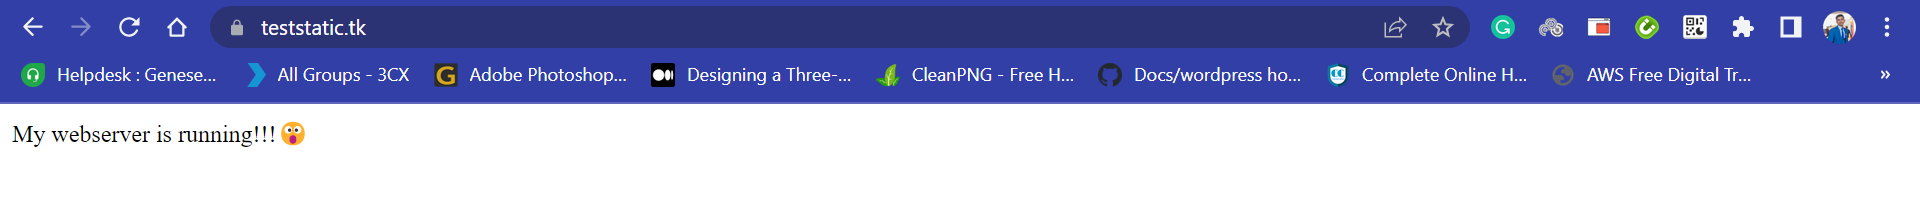
Once the SSL certificate is installed, check it on the browser.
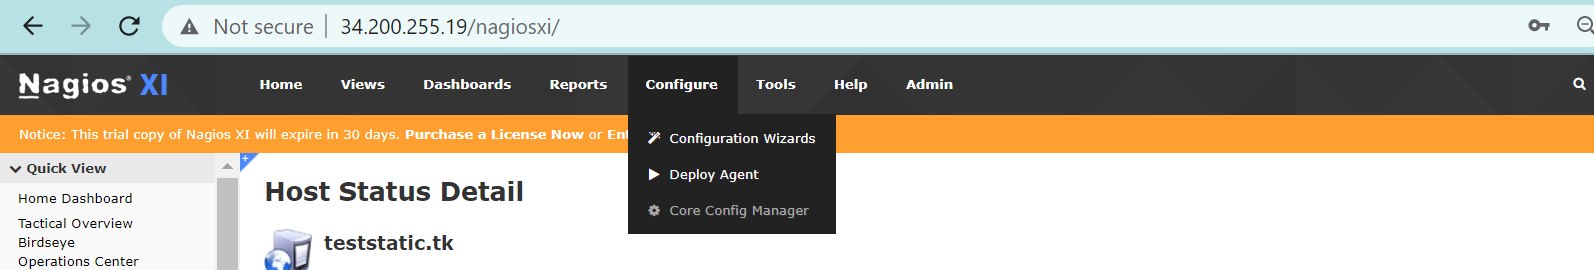
Go to nagiosxi.
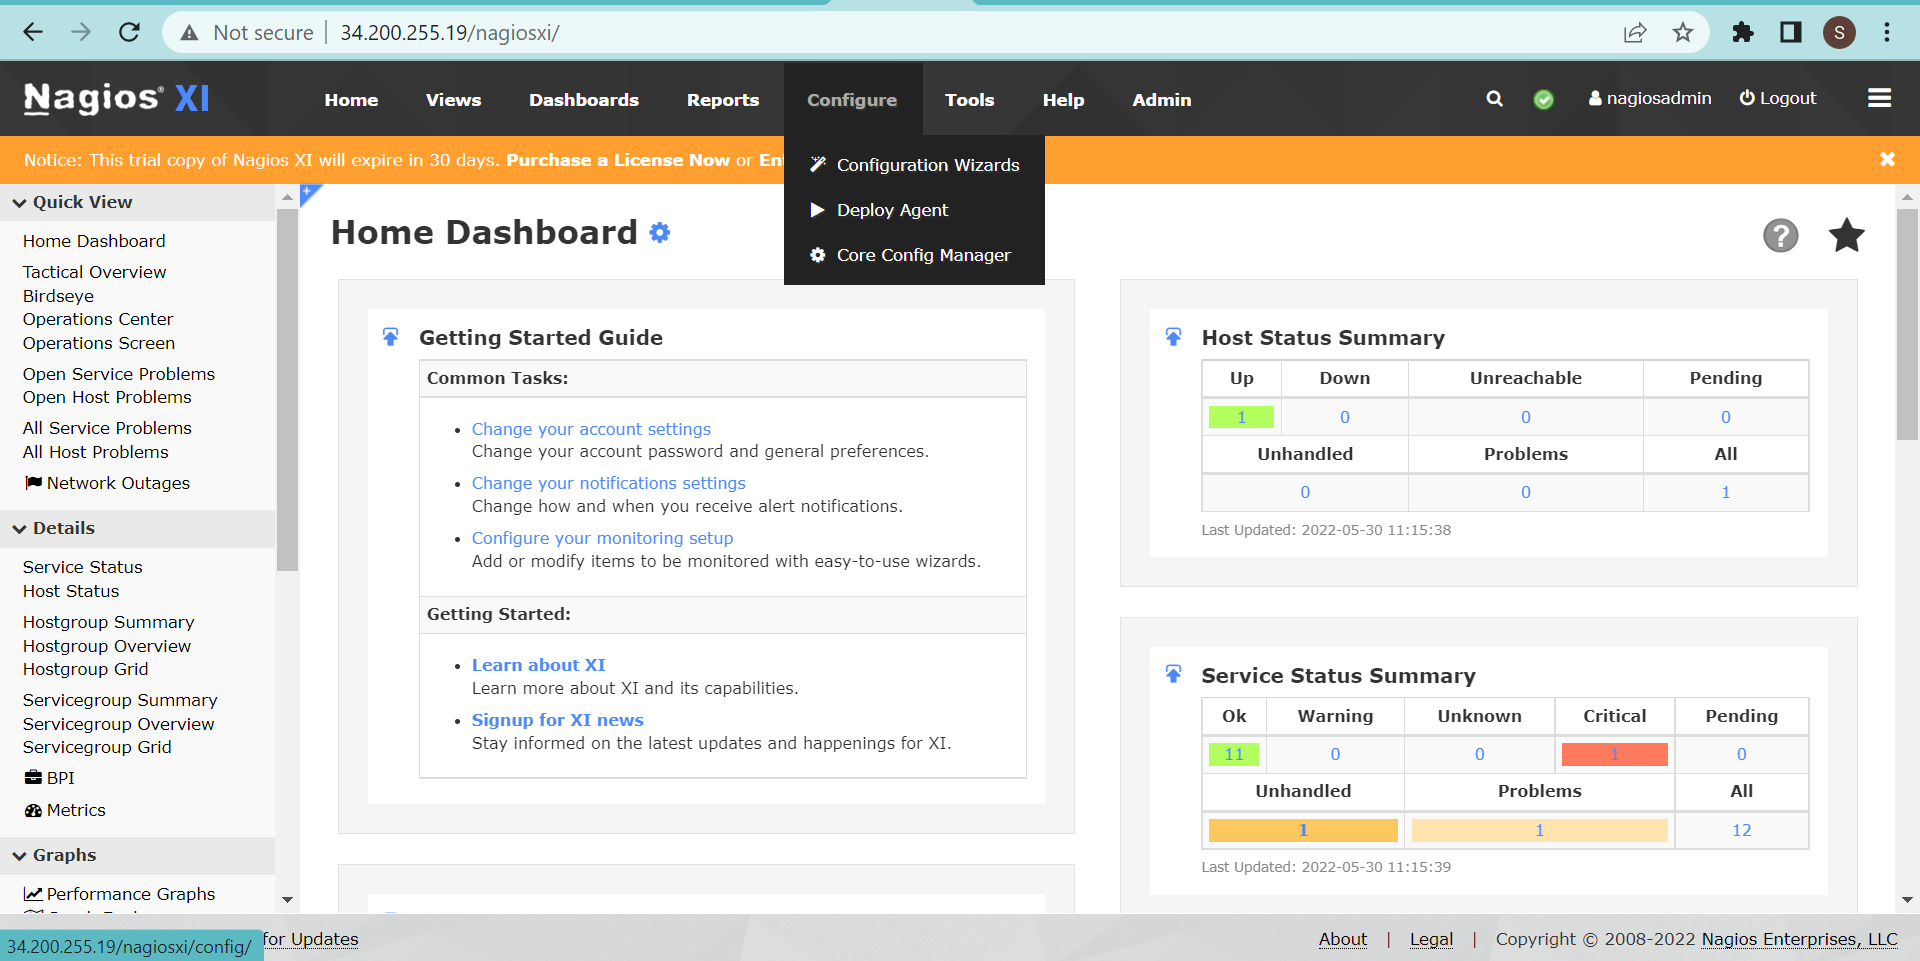
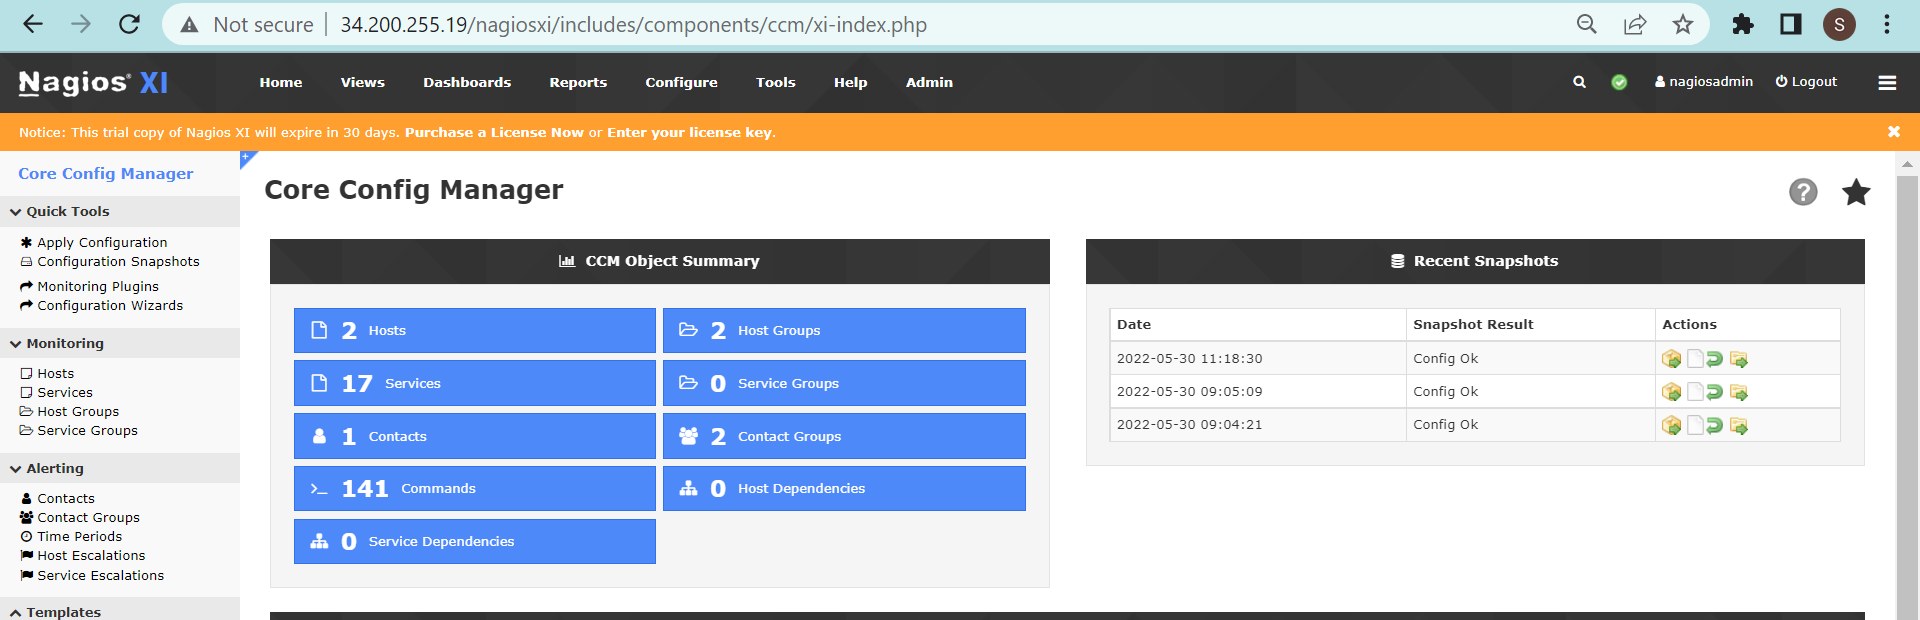
Goto Core Config Manager.
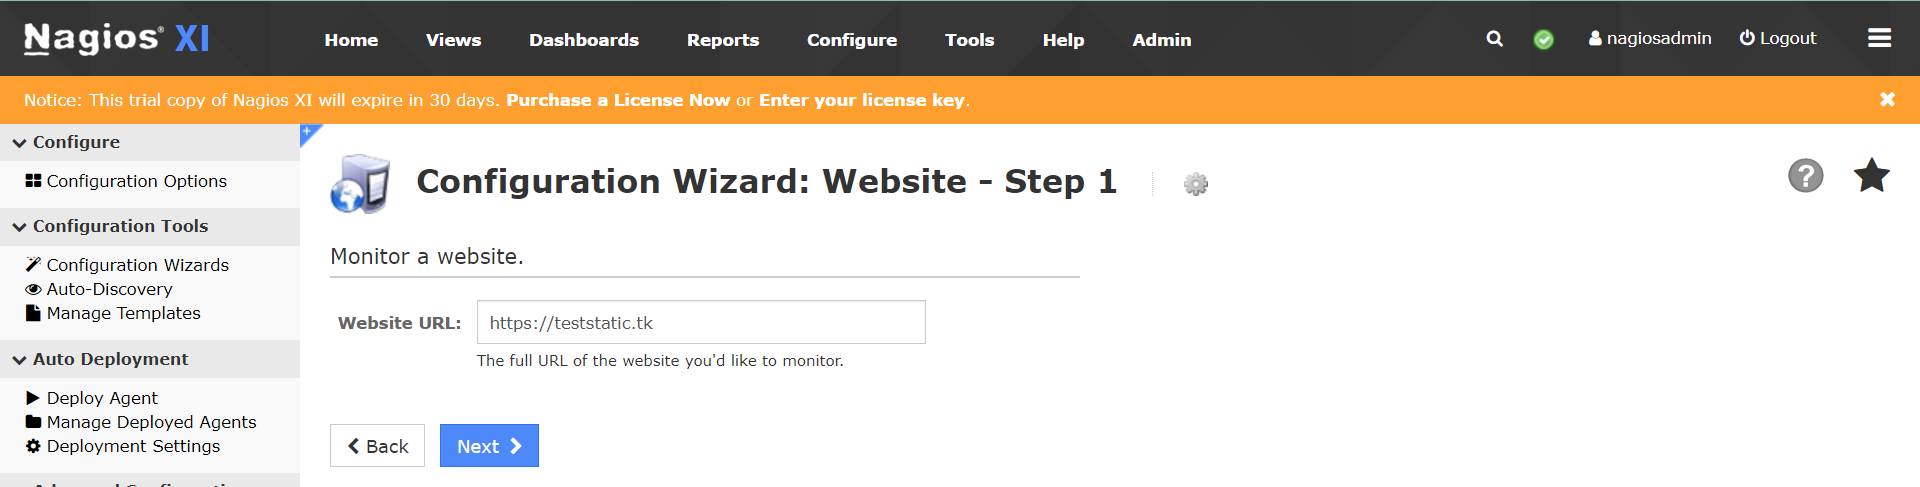
Click on Next.
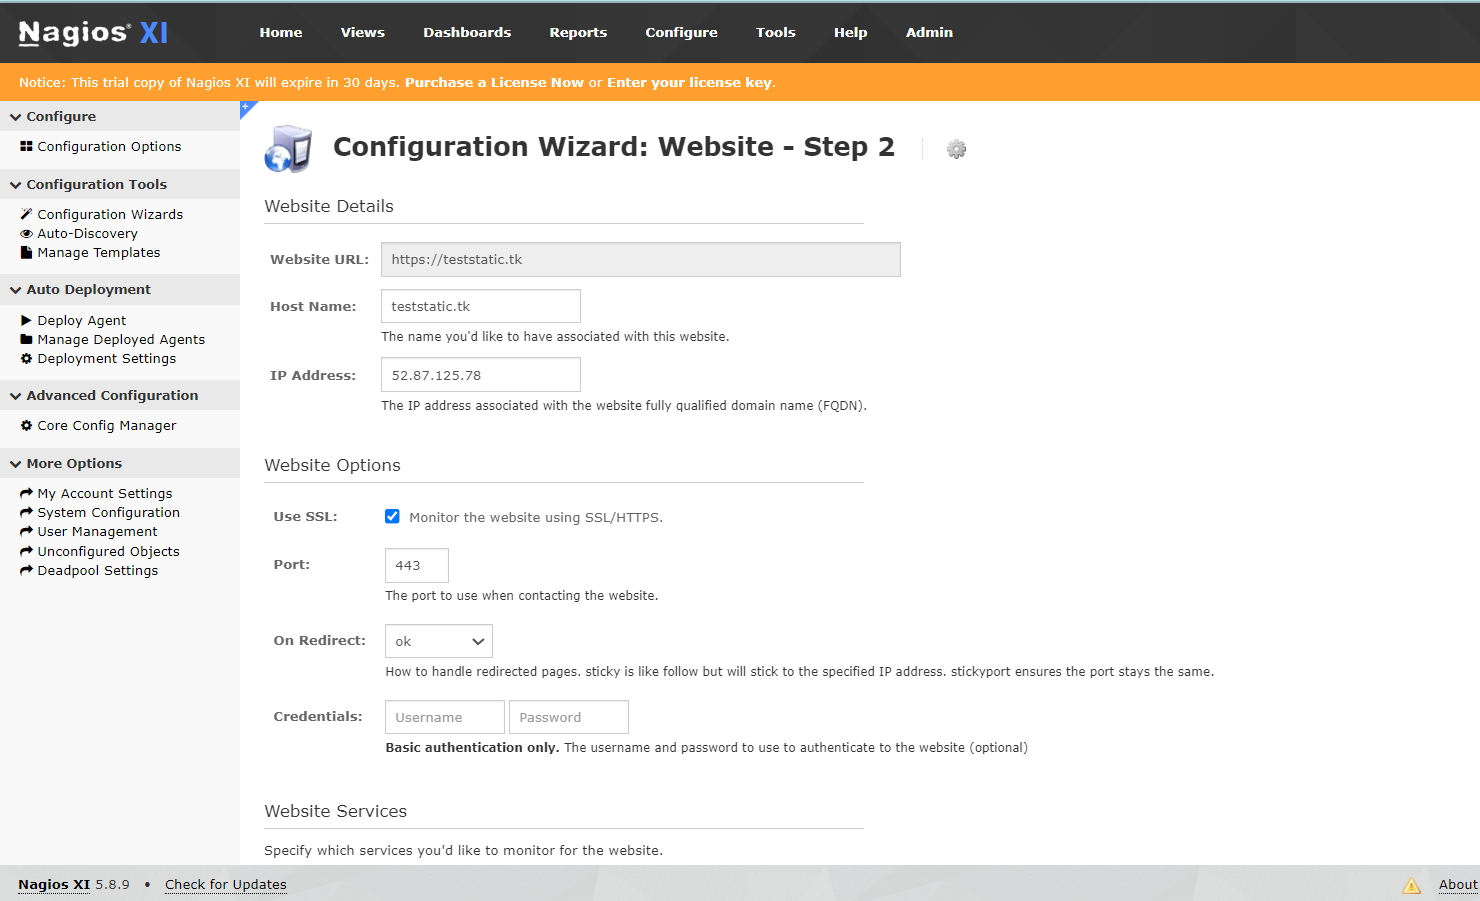
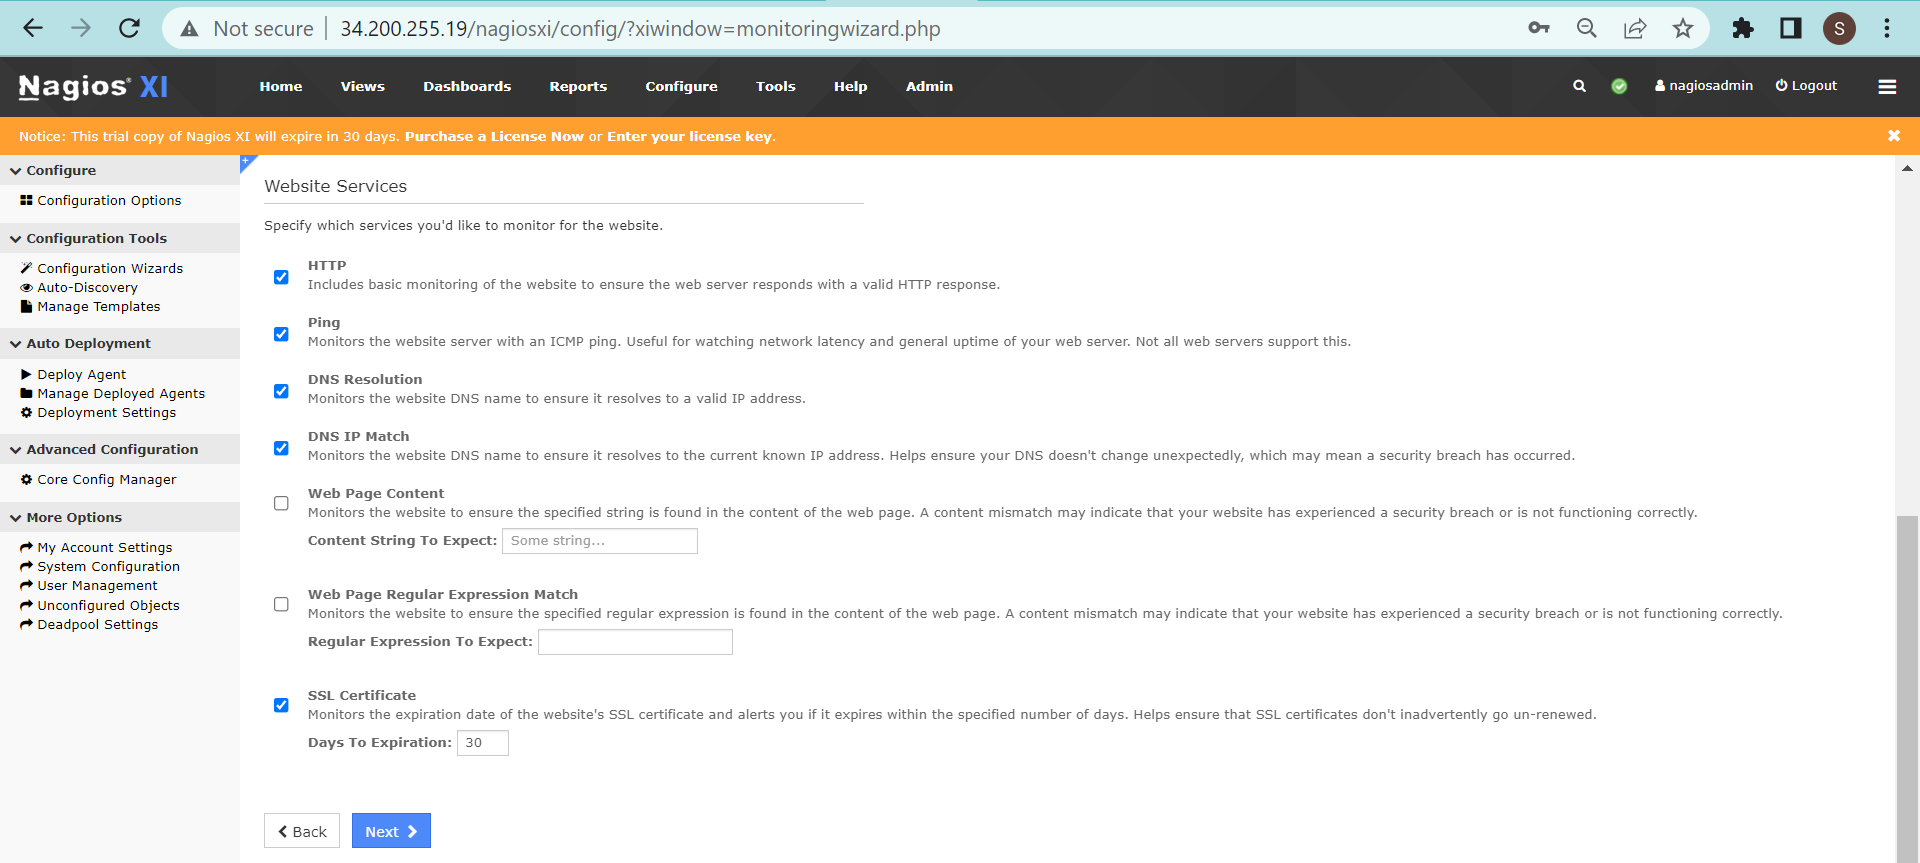
Click on Next.
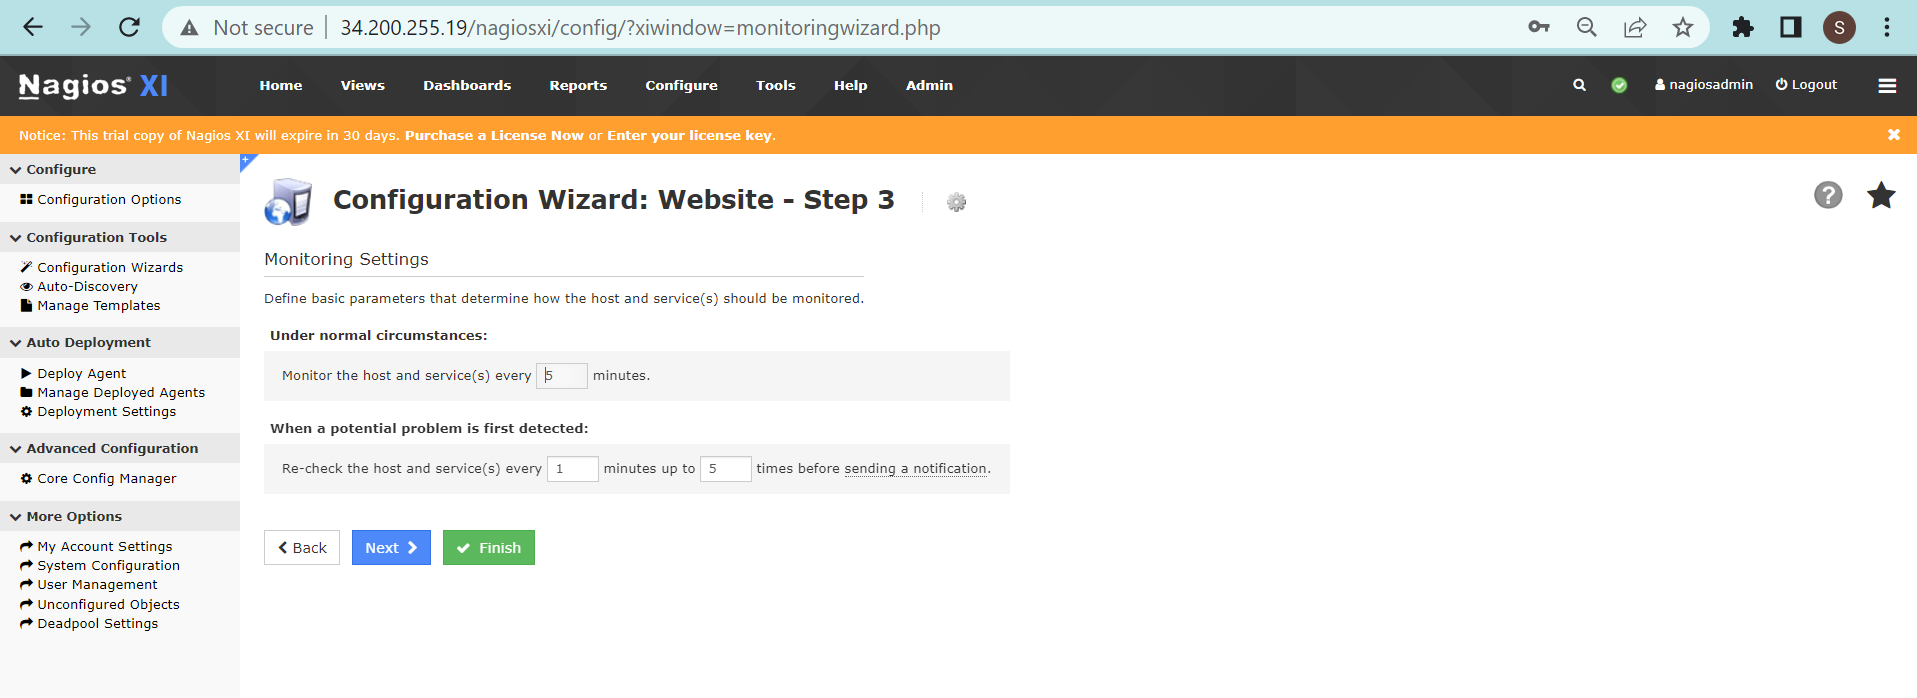
Click on finish.
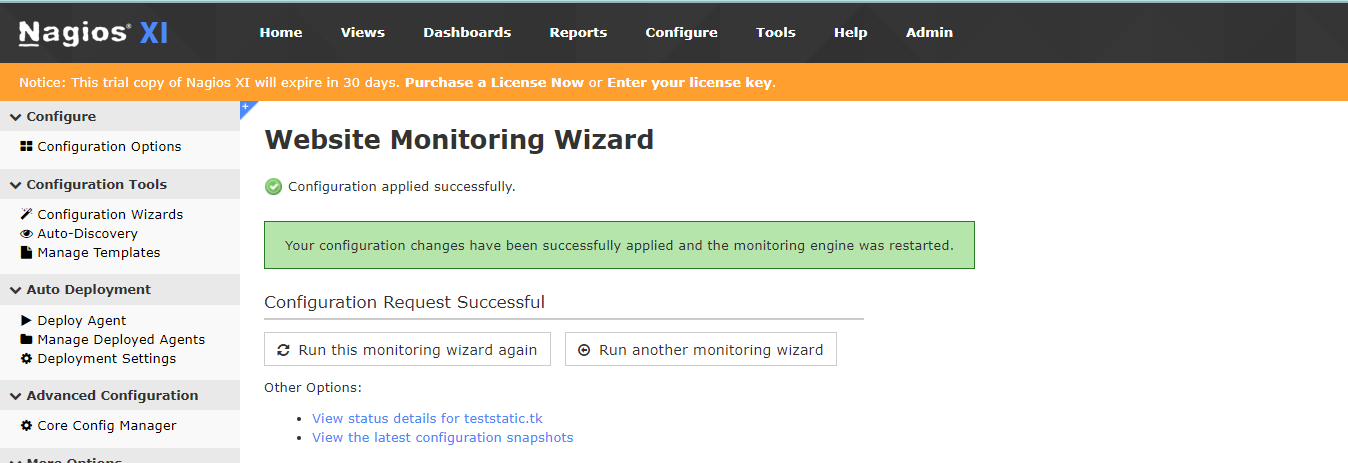
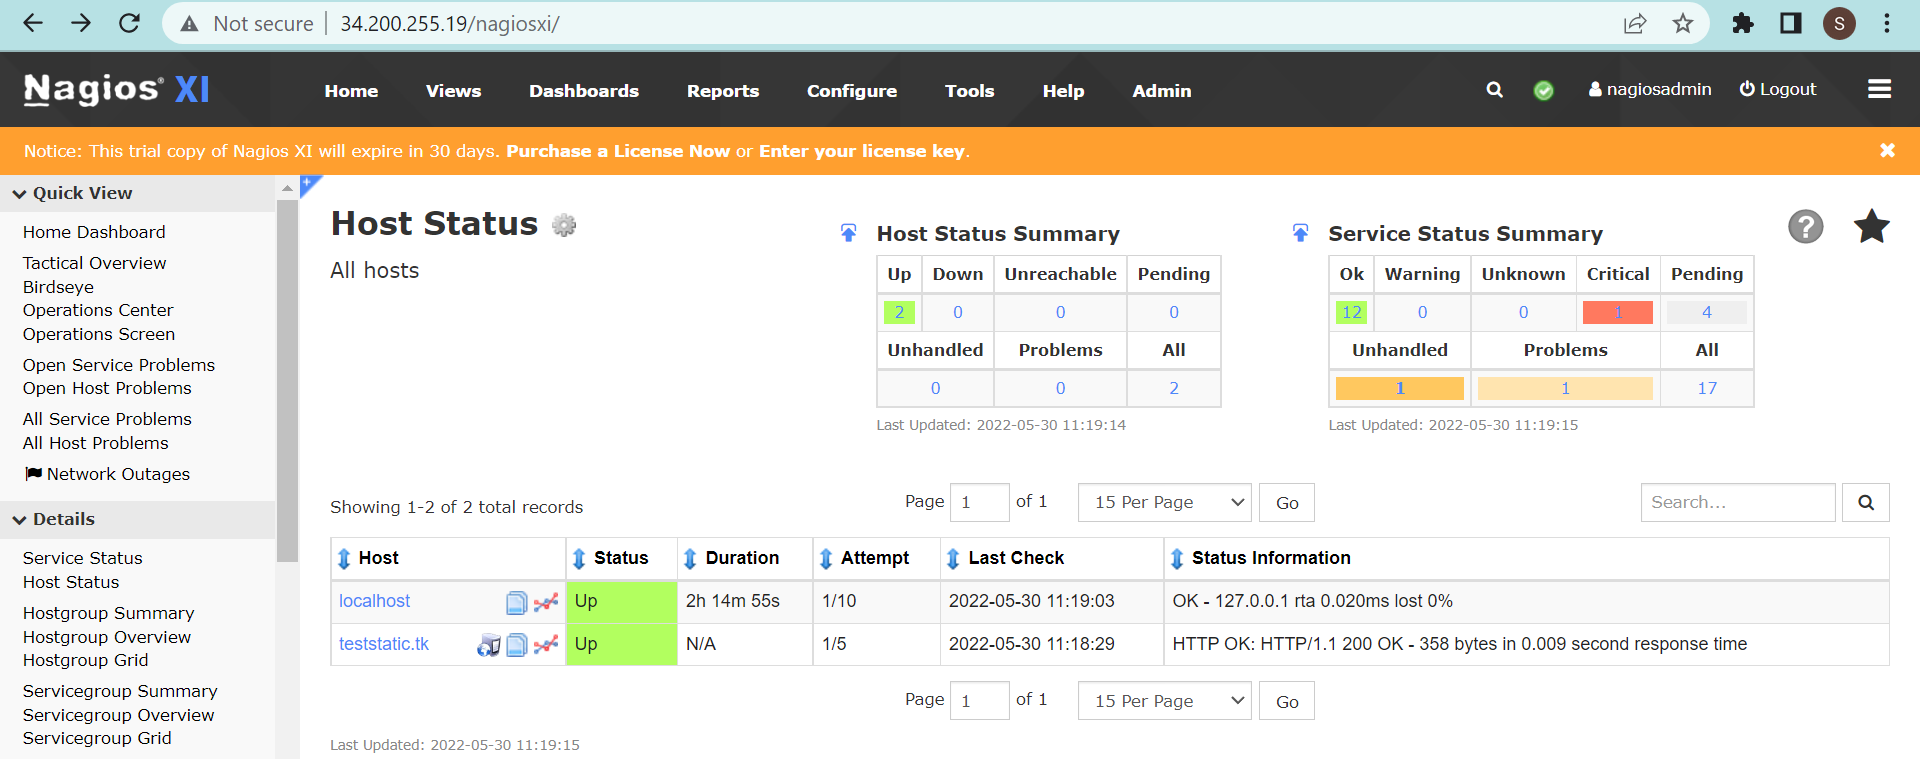
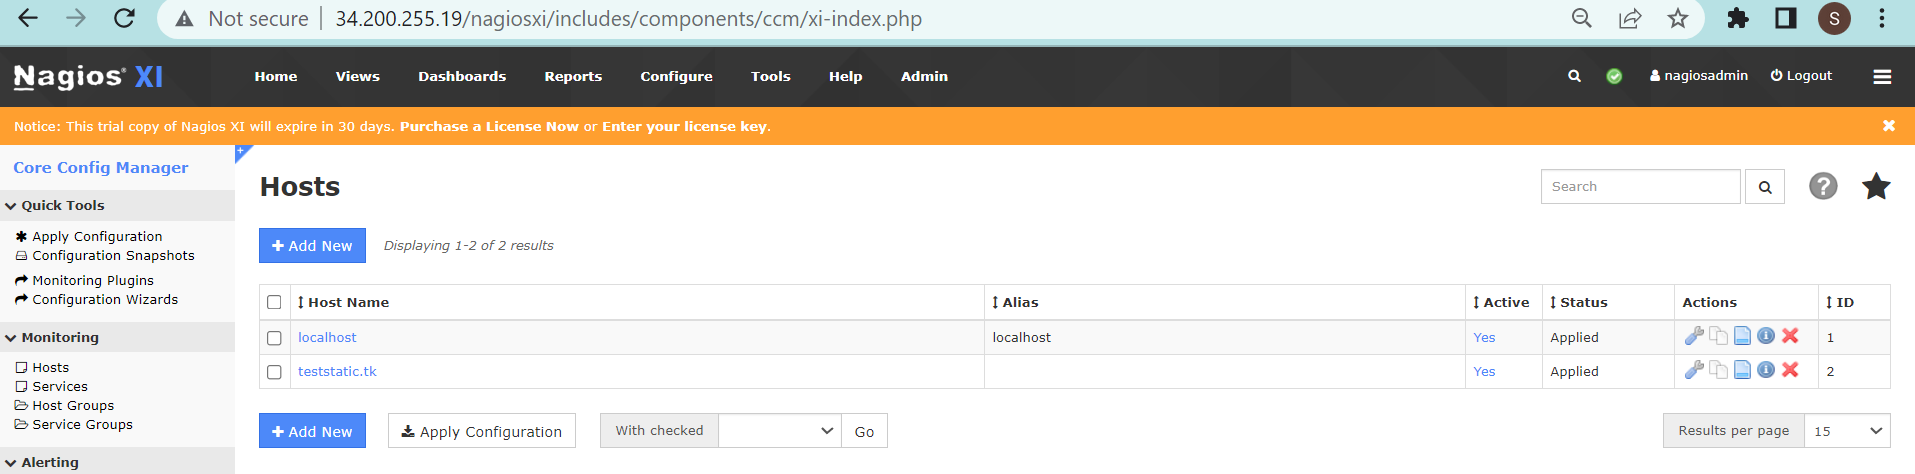
Once the configuration is done. Check host status.
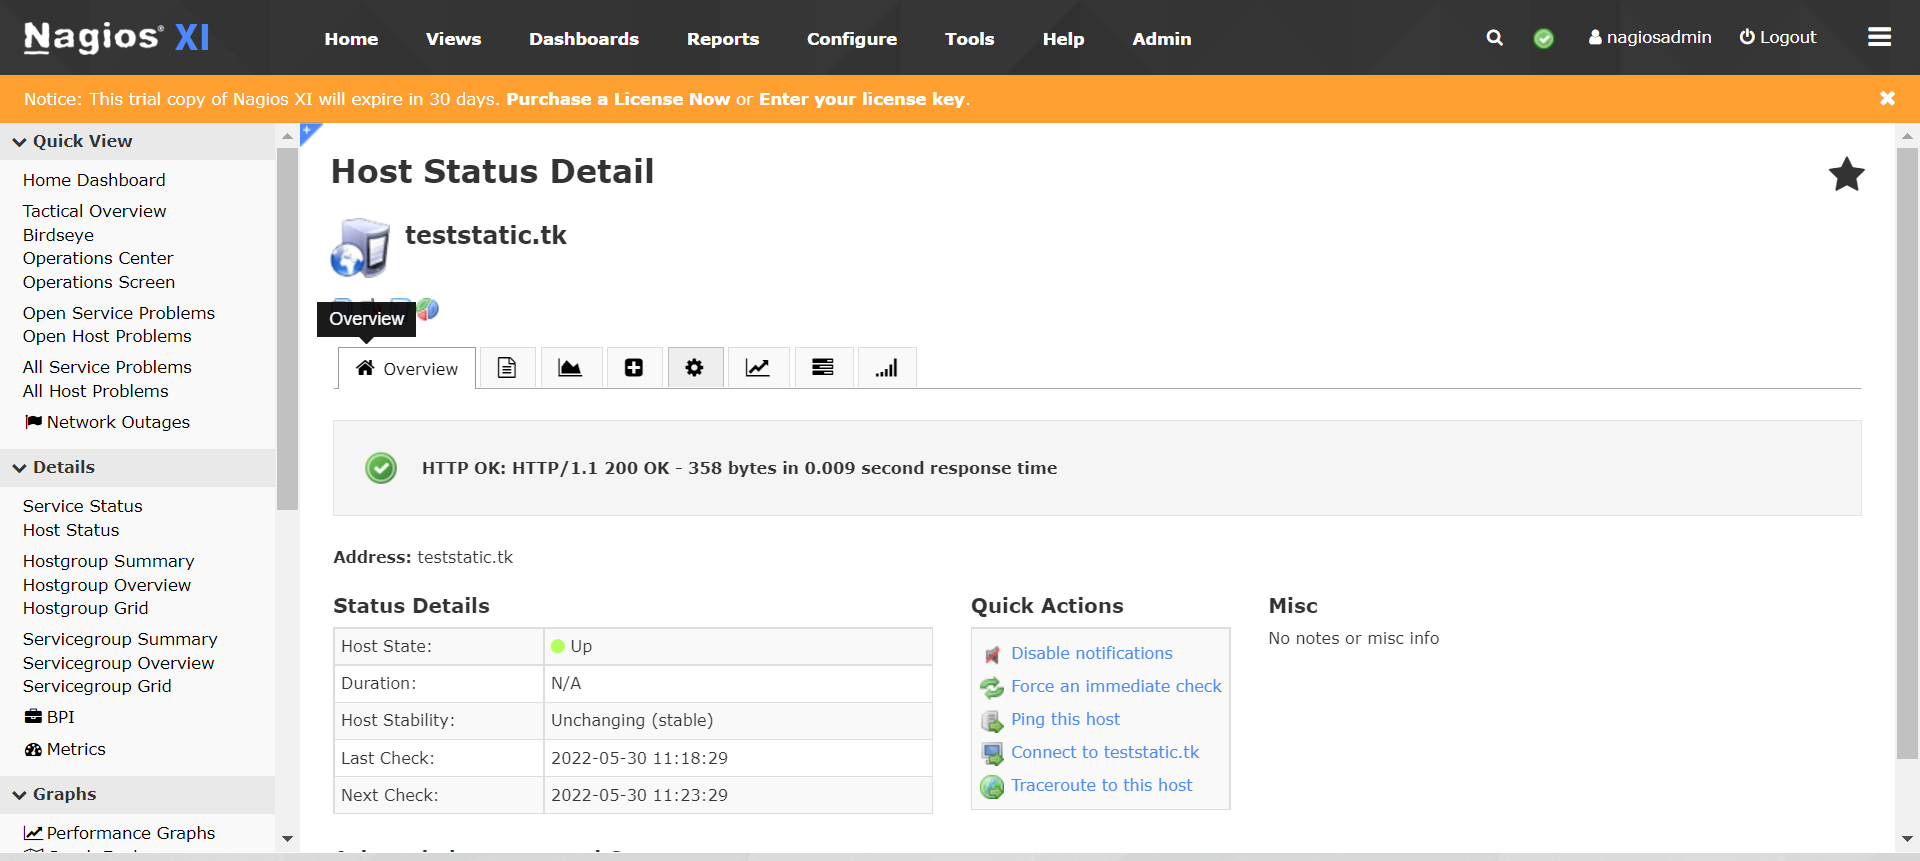
Click on your domain name.
Go to Services.
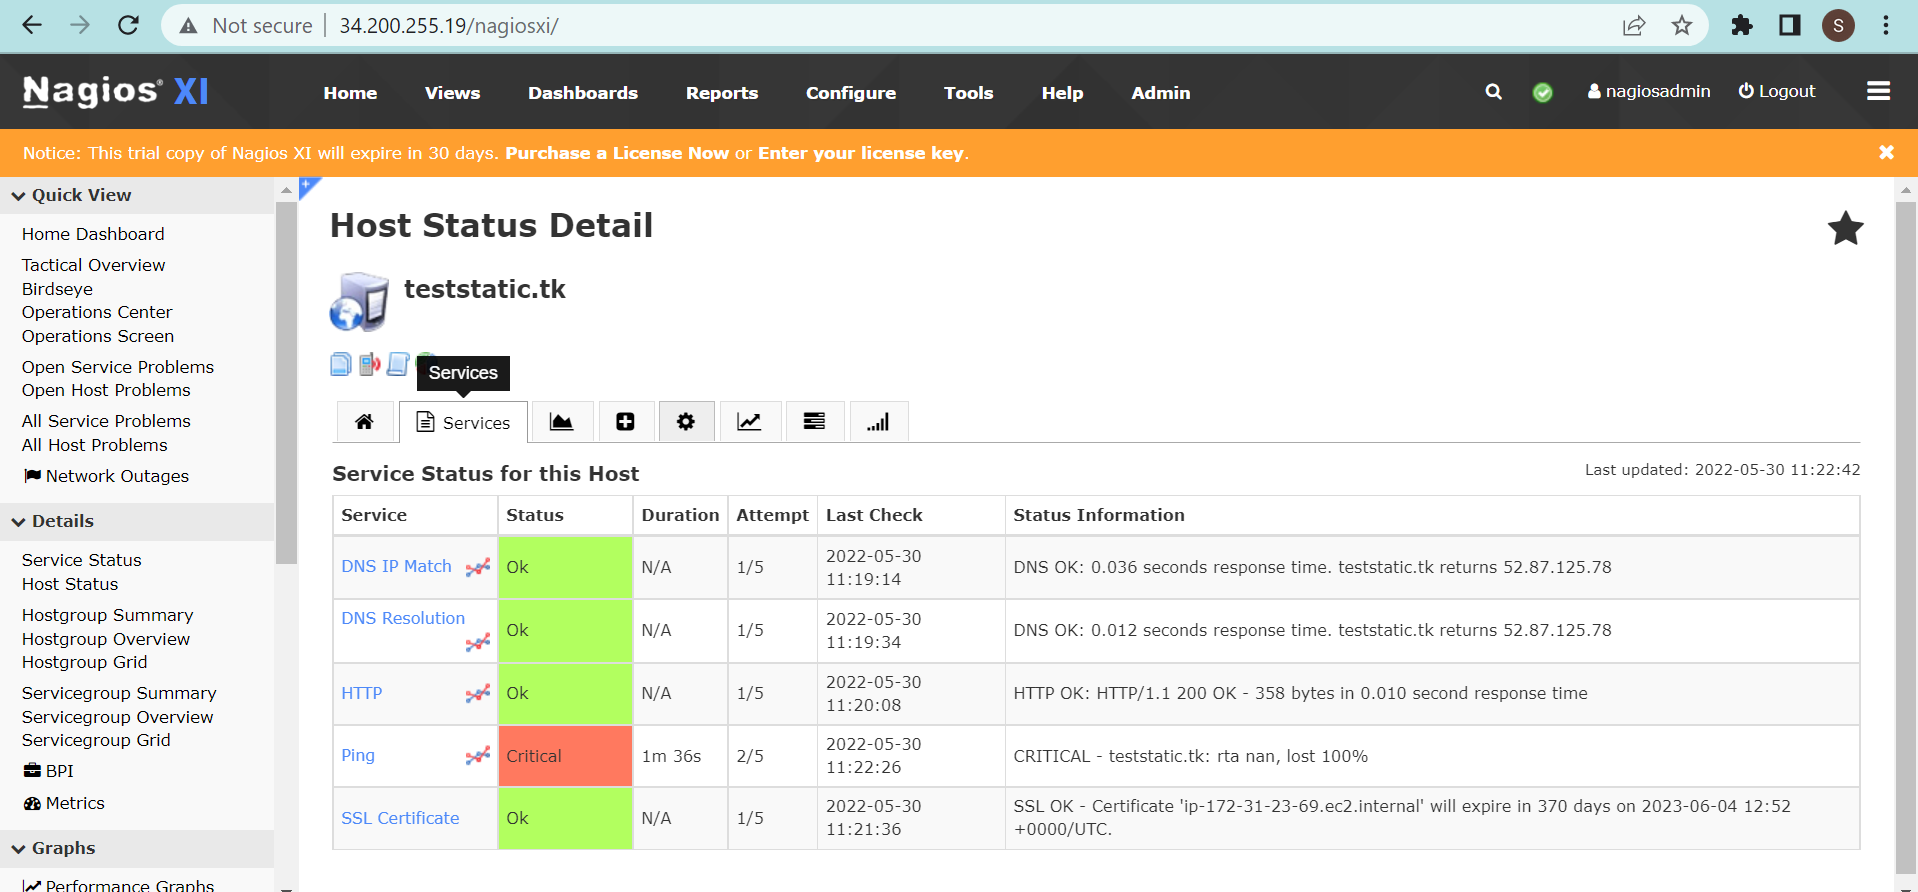
Once the SSL Certificate status information is updated. Go to your google account 2-step verification. And, set up the App password for mail.
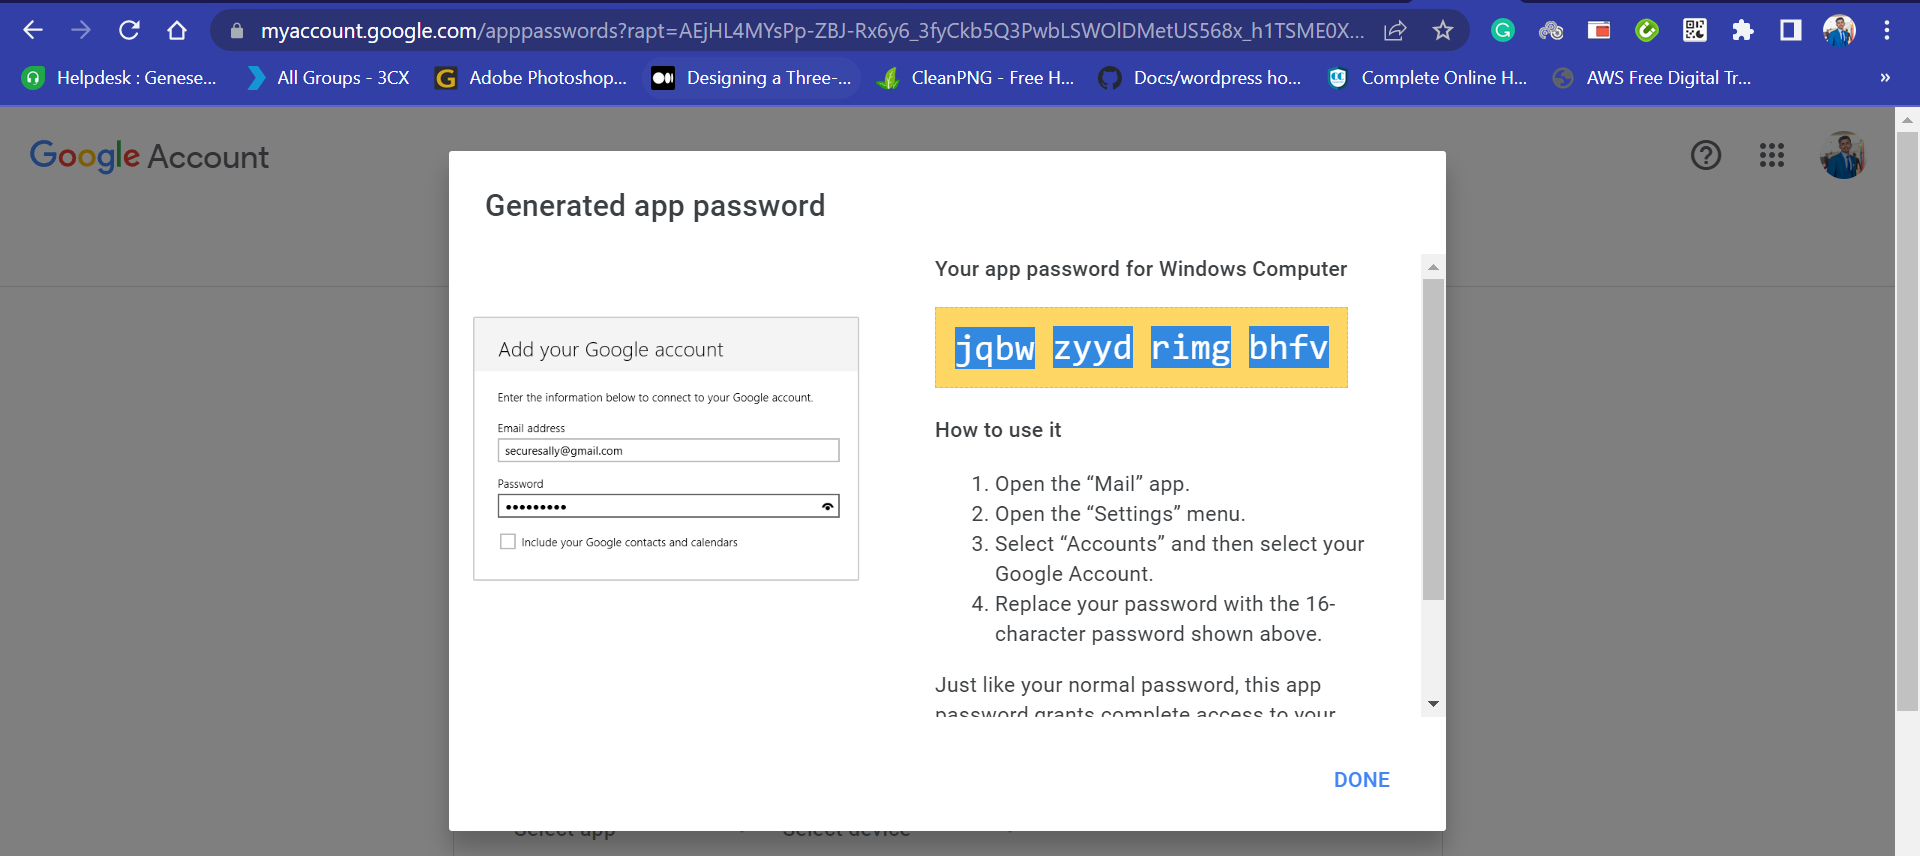
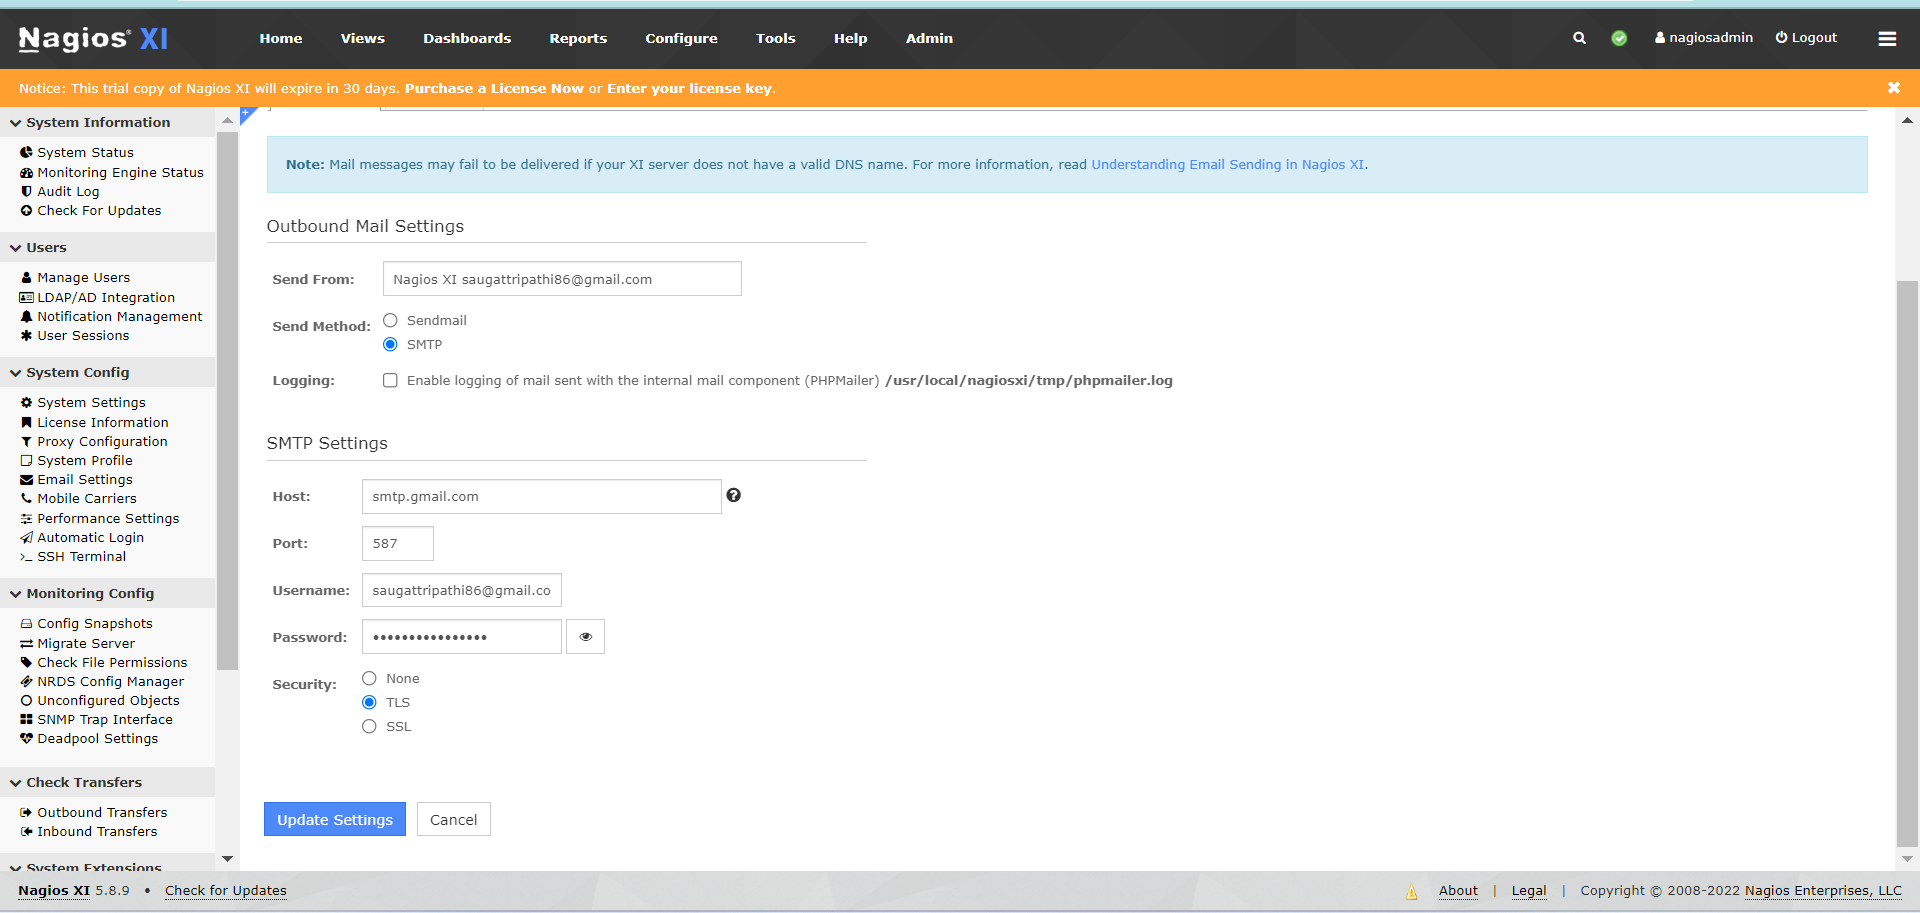
Copy that app password and used as password in following window:
Go to test mail and send test mail.
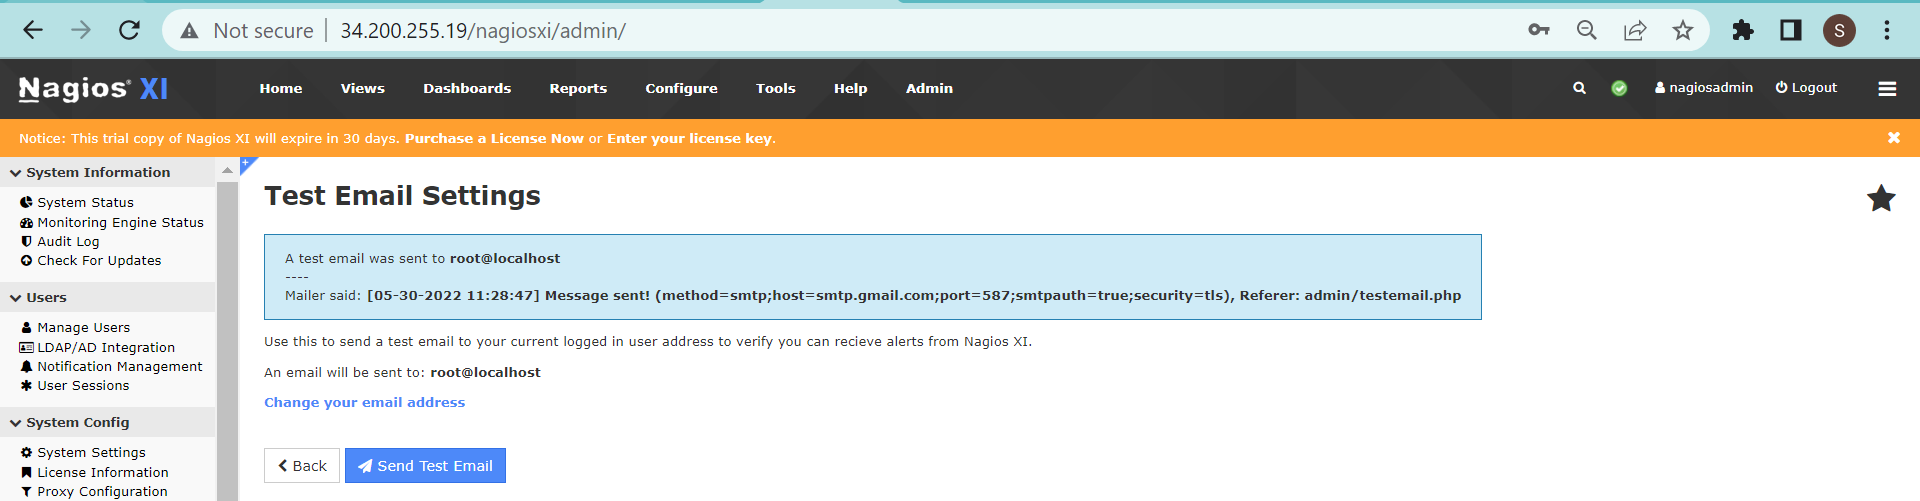
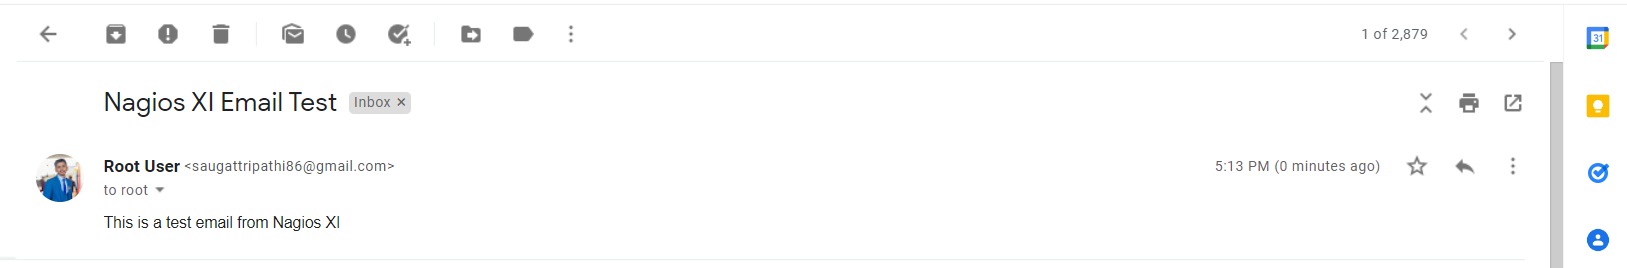
The test mail is sent to your gmail and go to your mailbox.
Go to nagiosxi again> host status for teststatic.tk
Click on core config Manager.
Click on your domain.
Go to host Host management and alert setting and set up as following:
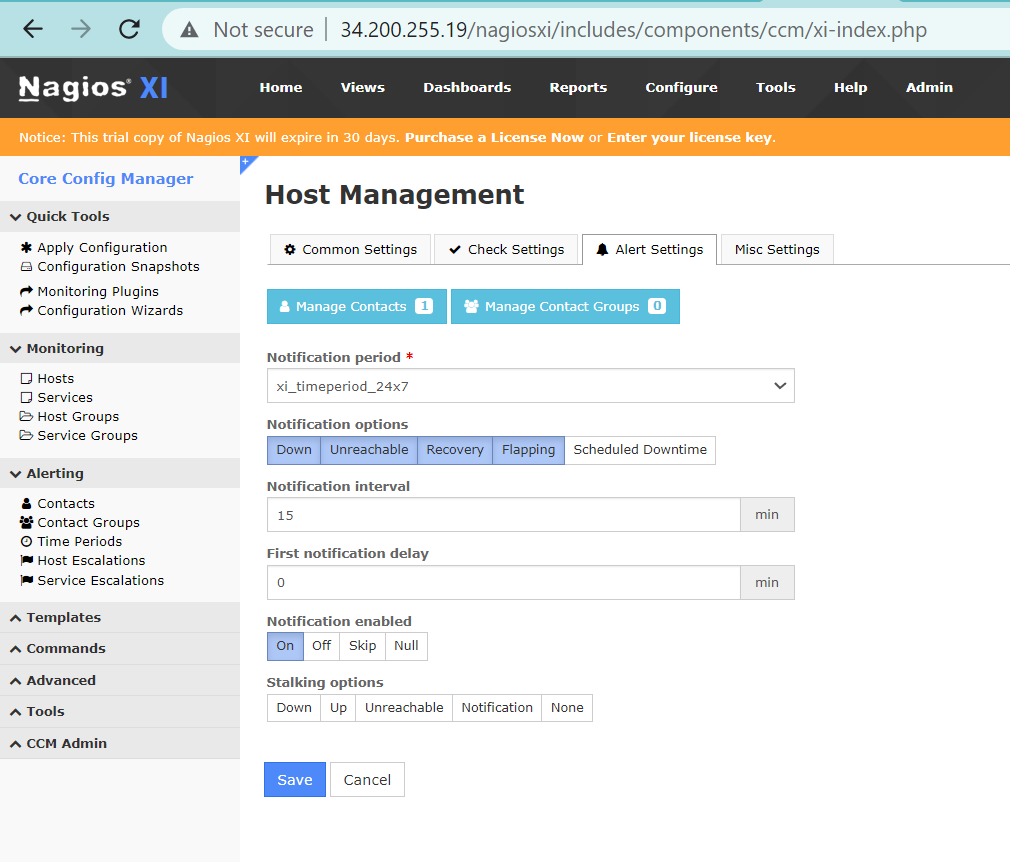
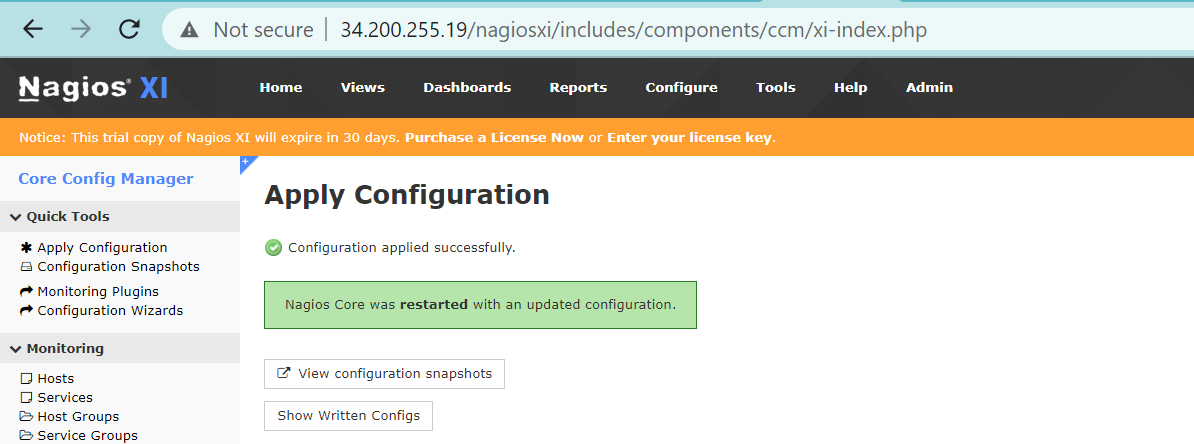
Apply configuration
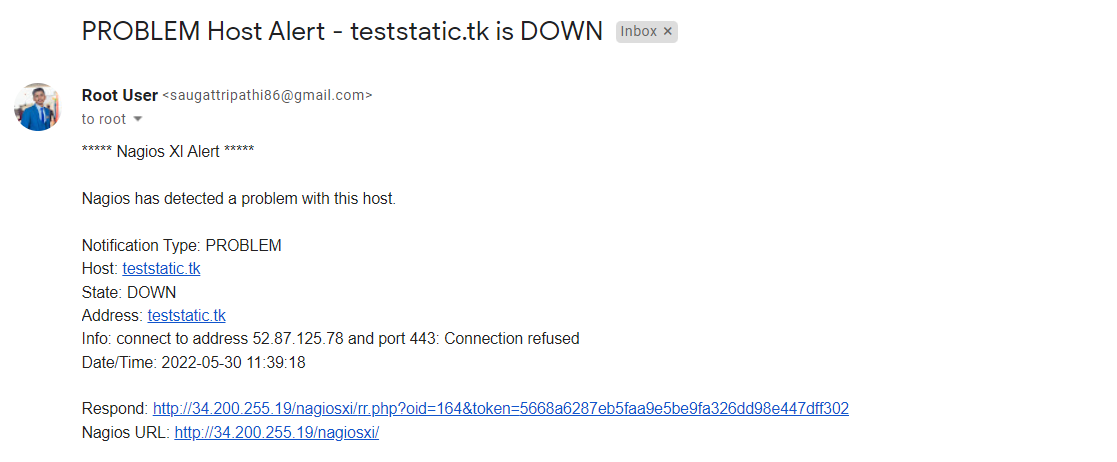
Stopping the instance.

Once the instance stopped the notification is sent to your mailbox.

Check your mailbox.
Conclusions:
Congratulations! You have successfully installed and configured Nagios XI for continuous monitoring. Enjoy reduced downtime and active monitoring of your services.
Stay tuned for more. Let’s connect on Linkedin and explore my GitHub for future insights.