Monitor AWS CloudWatch Logs and Send Alerts to PagerDuty with Terraform
In today’s cloud-native world, proactively monitoring logs is crucial for ensuring system reliability and minimizing downtime. Developers need automated tools to detect critical issues and notify the team immediately. If you’re using Terraform to manage AWS infrastructure, setting up CloudWatch Metric Filter and CloudWatch Alarm integrated with PagerDuty can help achieve this goal.
In this blog, we’ll go through the process of creating a
CloudWatch Metric Filterand CloudWatch Alarm using Terraform and sending alerts to PagerDuty.
The Problem: Detecting Errors in Logs and Triggering Alerts
In today’s applications, errors might not always cause immediate failures, but they can indicate underlying problems that could snowball into major issues. Manually reviewing logs is inefficient and prone to human error, especially in complex systems with high log volumes.
For instance, imagine your application logs contain the following log pattern%\\[error\\]|\\[crit\\]|\\[alert\\]|\\[emerg\\]%for error, critical, alert and emerg errors. You want to monitor these logs and notify your team on PagerDuty whenever such errors occur. Without automated monitoring, you risk missing these errors, leading to poor incident response times.
The solution? Use AWS CloudWatch Metric Filters to monitor logs for specific patterns and set up CloudWatch Alarms that trigger PagerDuty alerts for immediate action.
The Solution: Automating Log Monitoring and Alerting with CloudWatch and PagerDuty
You can search and filter the log data coming into CloudWatch Logs by creating one or more AWS CloudWatch Metric Filters. Metric filters define the terms and patterns to look for in log data as it is sent to CloudWatch Logs. CloudWatch Logs uses these metric filters to turn log data into numerical CloudWatch metrics that you can graph or set an alarm on. CloudWatch Alarms then monitor these metrics and trigger alerts when thresholds are breached. By integrating these alarms with PagerDuty, you ensure that incidents are routed to the right people at the right time.
With Terraform, you can automate the entire process, making it easy to set up and maintain your monitoring and alerting system.
Solution Steps:
Step 1: Create a CloudWatch Log Group
Ensure that your application logs are stored in a CloudWatch Log Group. If you don’t already have one, you can create it using Terraform:
resource "aws_cloudwatch_log_group" "this" {
  count = var.log_group_name == "" ? 1 : 0
  name = "/aws/lambda/job-runner"
}
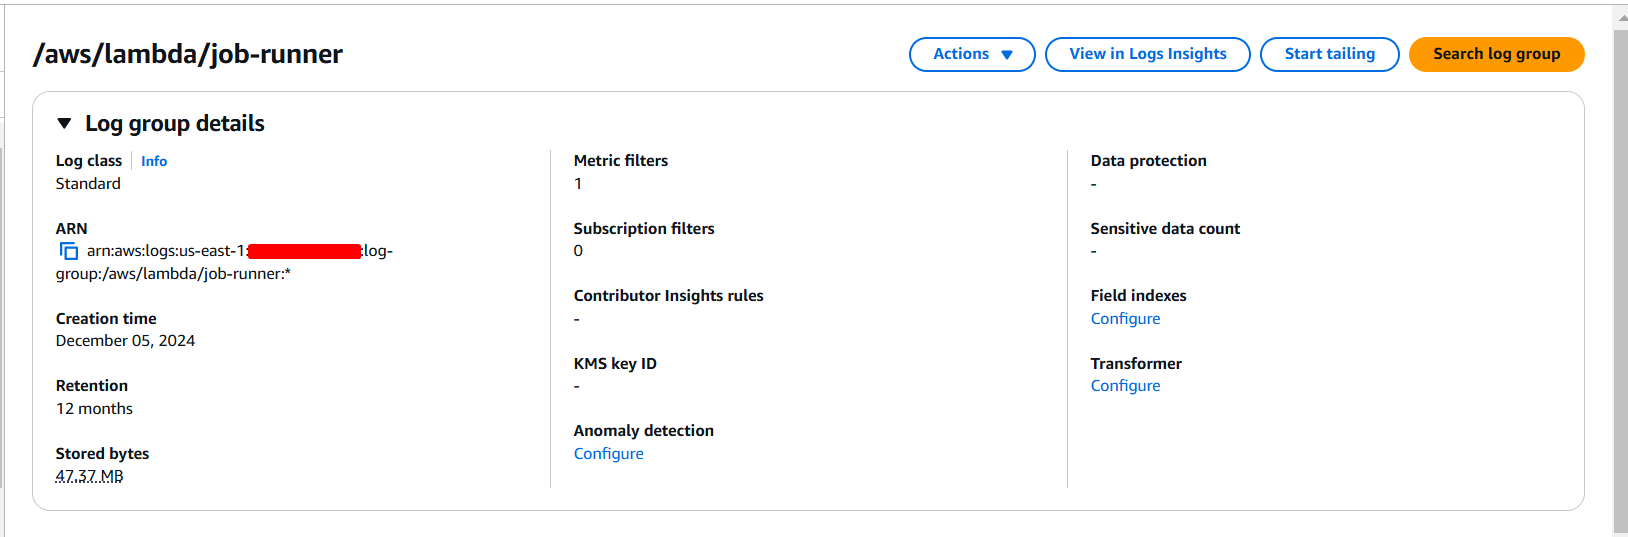
This log group will be the source for our Metric Filter.
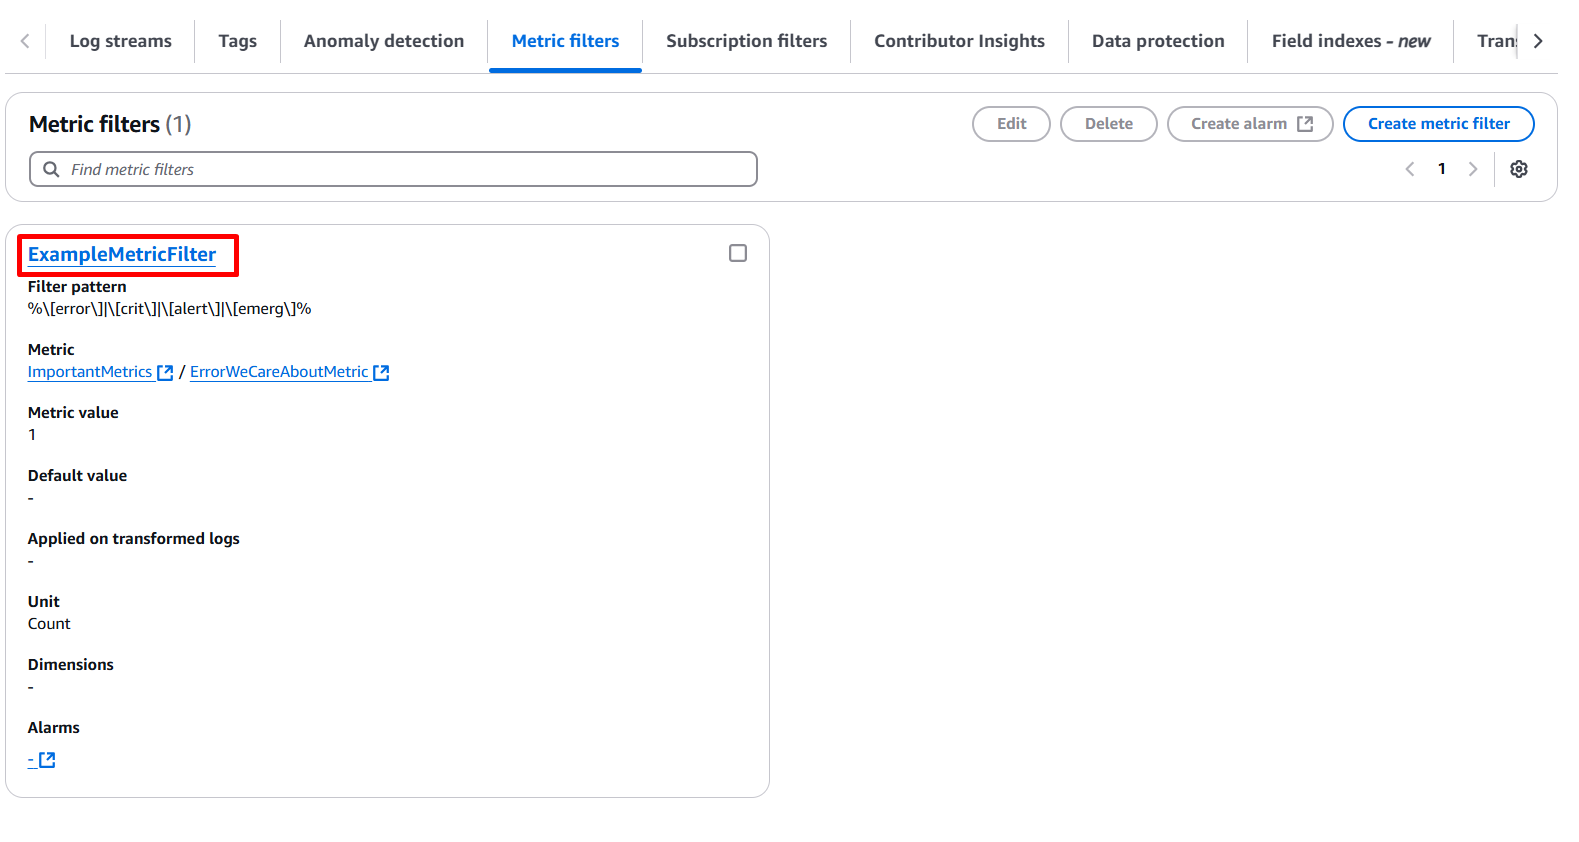
Step 2: Create a CloudWatch Metric Filter
Define a Metric Filter to scan the log group for specific patterns. In this case, we’re looking for logs containing ERROR_WE_CARE_ABOUT.
resource "aws_cloudwatch_log_metric_filter" "this" {
  name           = "ExampleMetricFilter"
  log_group_name = var.log_group_name == "" ? aws_cloudwatch_log_group.this.name : var.log_group_name
  pattern        = "%\\[error\\]|\\[crit\\]|\\[alert\\]|\\[emerg\\]%"
  metric_transformation {
    name      = "ErrorWeCareAboutMetric"
    namespace = "ImportantMetrics"
    value     = "1"
		unit      = "Count"
  }
}
- log_group_name: Links the filter to the CloudWatch Log Group.
- pattern: Defines the string or pattern to search for in the logs.
- metric_transformation: Converts matches into a metric, which will be used by the alarm.
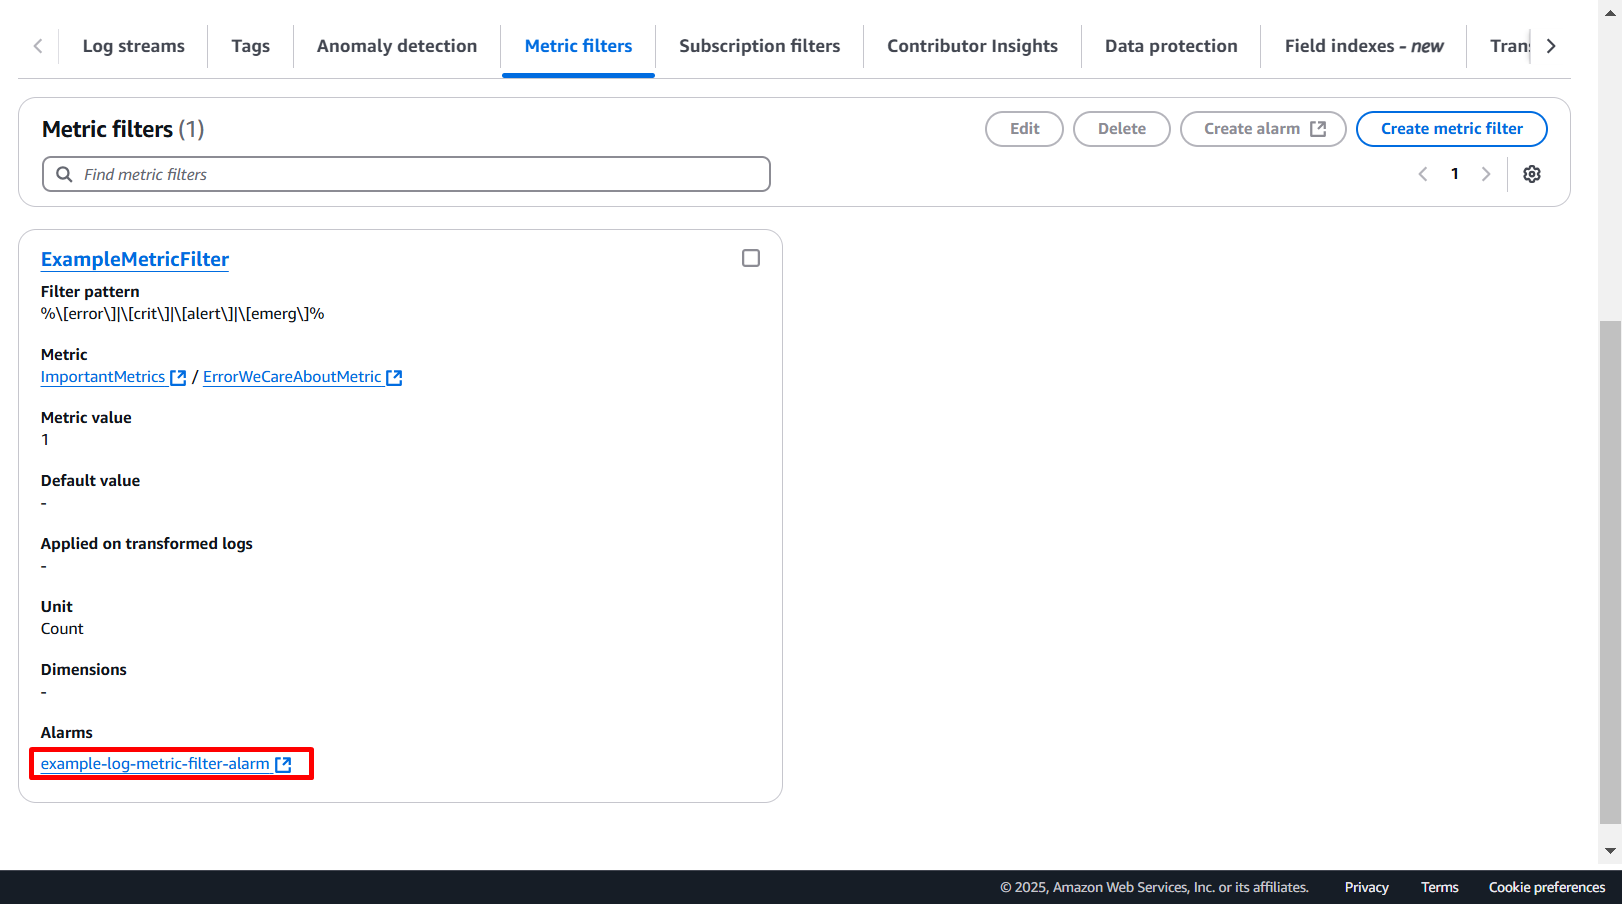
Step 3: Set Up a CloudWatch Alarm
Once the Metric Filter is in place, define a CloudWatch Alarm to monitor the metric. The alarm will trigger when the metric breaches a specified threshold.
module "example_cw_alarm" {
  source  = "terraform-aws-modules/cloudwatch/aws//modules/metric-alarm"
  version = "~> 3.0"

  alarm_name          = "example-log-metric-filter-alarm"
  alarm_description   = "Triggered when the comparision is greater than threshold"
  comparison_operator = "GreaterThanThreshold"
  threshold           = 1
  period              = 60 #Seconds
  treat_missing_data  = "missing"

  datapoints_to_alarm = 1
  evaluation_periods  = 1

  namespace   = "ImportantMetrics"
  metric_name = aws_cloudwatch_log_metric_filter.this.name
  statistic   = "Sum"
  alarm_actions = [aws_sns_topic.pagerduty.arn]
}
- threshold: Triggers the alarm when at least one matching log entry is detected.
- alarm_actions: Specifies the action to take when the alarm is triggered. Here, we’ll use an SNS topic integrated with PagerDuty.
Step 4: Integrate PagerDuty with AWS SNS
To send alerts to PagerDuty, you need to configure an SNS topic that routes notifications to PagerDuty’s incident management system. For this please follow my previous blog: https://saugaattiwari.com.np/blog/pagerduty/
Conclusion
Monitoring application logs for critical errors is essential for maintaining system reliability. By using AWS CloudWatch Metric Filters and Alarms, you can automate the detection of specific error patterns in logs. Integrating these alarms with PagerDuty ensures that incidents are quickly escalated to your team for resolution.
With Terraform, you can define and manage this entire setup as IAC, making it easy to scale and replicate across multiple environments.
Stay tuned for more. Let’s connect on Linkedin and explore my GitHub for future insights.