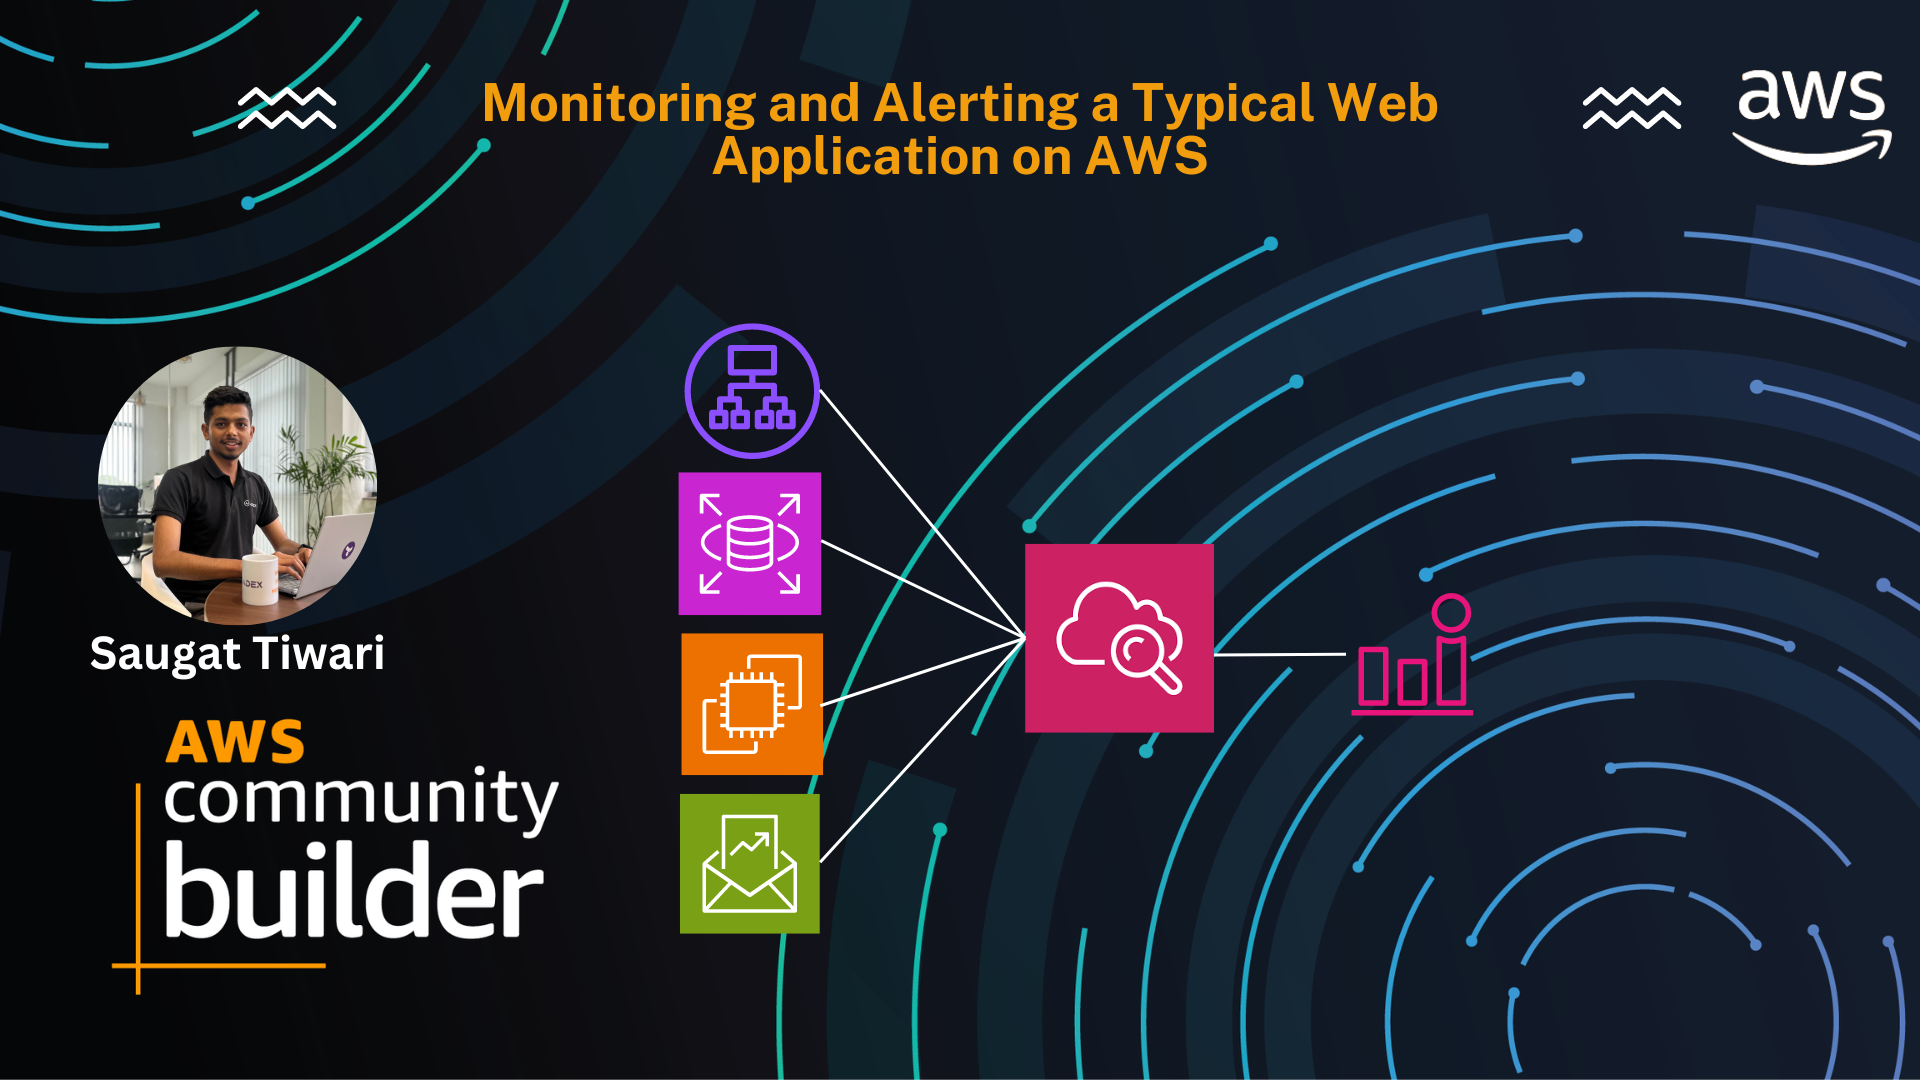
Monitoring and Alerting a Typical Web Application on AWS
Introduction
In the fast-paced world of web applications, ensuring the reliability and performance of your services is crucial. Monitoring and alerting are essential components of maintaining a robust web application infrastructure on AWS. To save the time and energy while monitoring your web application on AWS, you only need to notify yourself or your team if your customers are affected by a problem or if the application hits a failure it can’t fix on its own.
Problem
Monitoring a web application can be overwhelming, especially with the multitude of metrics available on AWS. The challenge lies in identifying which metrics are crucial for the health of your application and setting up appropriate alerts. The goal is to notify yourself or your team only when there is a significant issue affecting your customers or when the application encounters a failure it cannot resolve on its own. By doing so, you can focus on what matters most and avoid unnecessary alerts.
Prerequisite:
Before diving into the monitoring setup, ensure you have the following prerequisites:
- An AWS account
- A web application hosted on AWS, utilizing services such as Application Load Balancer (ALB), Relational Database Service (RDS), and Simple Queue Service (SQS).
- Basic knowledge of AWS CloudWatch for monitoring and setting up alarms.
Solutions:
The following shows the minimal monitoring setup for a web application on AWS:
Monitoring the Application Load Balancer (ALB)
The ALB is the entry point to your infrastructure, making it a critical component to monitor. Key metrics to watch include server errors (5XX), latency, and rejected connections.
| Alarm For | Descriptions | Metric namespace | Metric name | Metric dimension | Metric period | Number of periods | Statistic | Alarm Threshold |
|---|---|---|---|---|---|---|---|---|
| 5XX Errors by Load Balancer | Monitors server inability to process a request, often resulting in an error message | AWS/ApplicationELB | HTTPCode_ELB_5XX_Count | LoadBalancer ID | 1 minute | 5 or 1 out of 5 | Sum | Greater than 1 |
| 5XX Errors by Target | Monitors server inability to process a request, often resulting in an error message | AWS/ApplicationELB | HTTPCode_Target_5XX_Count | LoadBalancer ID | 1 minute | 5 or 1 out of 5 | Sum | Greater than 1 |
| Latency | High latency can lead to customer dissatisfaction. Monitor the latency between the load balancer and your EC2 instances. | AWS/ApplicationELB | TargetResponseTime | LoadBalancer ID | 1 minute | 5 or 1 out of 5 | Average (if less than 1000 requests per minute) | > 0.2 seconds |
| Rejected Connections | Monitor for rejected connections to ensure the ALB scales appropriately | AWS/ApplicationELB | RejectedConnectionCount | LoadBalancer ID | 1 minute | 5 or 1 out of 5 | Sum | Greater than 1 |
Relational Database Service (RDS)
Monitor the available resources for your RDS instance, focusing on free storage space to prevent failures or data corruption:
| Alarm For | Descriptions | Metric namespace | Metric name | Metric dimension | Metric period | Number of periods | Statistic | Alarm Threshold |
|---|---|---|---|---|---|---|---|---|
| Checking free storage | Monitor the available resources for your RDS instance | AWS/RDS | FreeStorageSpace | DBInstanceIdentifier | 1 minute | 5 or 1 out of 5 | Minimum | < 1000000000 Bytes |
Simple Queue Service (SQS)
Ensure the smooth processing of batch jobs by monitoring the age of the oldest message in your SQS queue and the length of the dead-letter queue.
| Alarm For | Descriptions | Metric namespace | Metric name | Metric dimension | Metric period | Number of periods | Statistic | Alarm Threshold |
|---|---|---|---|---|---|---|---|---|
| Oldest Message Age | Monitor the age of oldest message in the queue | AWS/SQS | ApproximateAgeOfOldestMessage | QueueName | 5 minutes | 5 or 1 out of 5 | Maximum | < 500 Sec |
| Dead-Letter Queue Length | Monitor the length of DLQ | AWS/SQS | ApproximateNumberOfMessagesVisible | QueueName | 5 minutes | 5 or 1 out of 5 | Maximum | > 0 |
EC2 Instances: App
You don’t need to monitor the EC2 instances which your application is running on. All failure conditions are resulting in 5XX errors or high latencies which you are monitoring at the load balancer already.
EC2 Instances: Worker
It is not necessary to monitor the EC2 instances running the workers processing the jobs from the queue. When the workers fail or there are not enough resources available, one of the alarms on SQS queues will trigger.
Finally, you should monitor the money your infrastructure is burning every day.
Budget Monitoring
Monitor your infrastructure costs using AWS Budgets to set alarms based on actual and forecasted spend:
- Utilize AWS Budgets for detailed cost monitoring and alerts. The possibility send alarms based on the actual spend until the current day of the month as well as the forecasted spend projected on the end of the month.
Conclusion
By focusing on these key metrics and setting up appropriate CloudWatch alarms, you can effectively monitor and maintain your web application’s health on AWS. This approach ensures that you are only alerted to significant issues, allowing you to respond quickly to problems that directly impact your customers. Implementing these monitoring practices will help you maintain a reliable and efficient web application infrastructure on AWS.
Stay tuned for more. Let’s connect on Linkedin and explore my GitHub for future insights.
