
Visualising AWS CloudWatch Logs using AWS Log Insights
Centralizing the logs from all your systems is critical in a cloud infrastructure. Typical solutions to store and analyze log messages are: Elastic Stack (Elasticsearch + Kibana), Loggly, Splunk, and Sumo Logic.
I prefer Amazon CloudWatch Logs in most cases. Why? Because CloudWatch Logs is a fully-managed service and scales horizontally. Also, CloudWatch Logs is billed by used storage and data ingestion, which means there are no idle costs.
The analytics functionality of CloudWatch Logs was minimal compared to the competitors. However, AWS released a new feature in November 2018: CloudWatch Logs Insights.
In this blog post, you will learn how to analyze your log messages with CloudWatch Logs Insights like a pro.
What is CloudWatch Logs Insights?
CloudWatch Logs Insights is an extension of CloudWatch Logs.
The key benefits of CloudWatch Logs Insights are:
- Fast execution
- Insightful visualization
- Powerful syntax
Analyzing log messages with CloudWatch Logs Insights costs $0.005 per GB of data scanned (see CloudWatch pricing for costs in other regions than U.S. East N. Virginia).

For the following log query scenario here is the architecture diagram that we have setup to go through:

This diagram shows the end-to-end flow of how AWS Lambda logs are generated, stored, and analyzed using CloudWatch Log Insights. When a Lambda function runs, whether triggered by an API call, an EventBridge schedule, or another AWS service, it automatically emits logs. These include system-generated logs like START, END, and REPORT, as well as any application logs written using print() or logging libraries inside the function code.
All of these logs are collected by Amazon CloudWatch, which acts as the central monitoring service in AWS. CloudWatch stores the log events in CloudWatch Logs, organized into log groups (one per Lambda function) and log streams (per execution environment). At this stage, the logs are raw text and are mainly useful for basic viewing or manual debugging.
CloudWatch Logs Insights sits on top of CloudWatch Logs and provides a powerful query interface to analyze this data. Using SQL-like queries, you can filter specific Lambda executions, parse values such as execution duration or memory usage from REPORT logs, and calculate metrics like averages or percentiles over time. This allows teams to understand performance trends, detect slow executions, investigate failures, and build dashboards or alerts, all without modifying the Lambda function itself.
In short, the flow demonstrates how Lambda operational data moves from execution to storage and finally to analysis, enabling effective monitoring, troubleshooting, and performance optimization using CloudWatch Log Insights.
How to query logs?
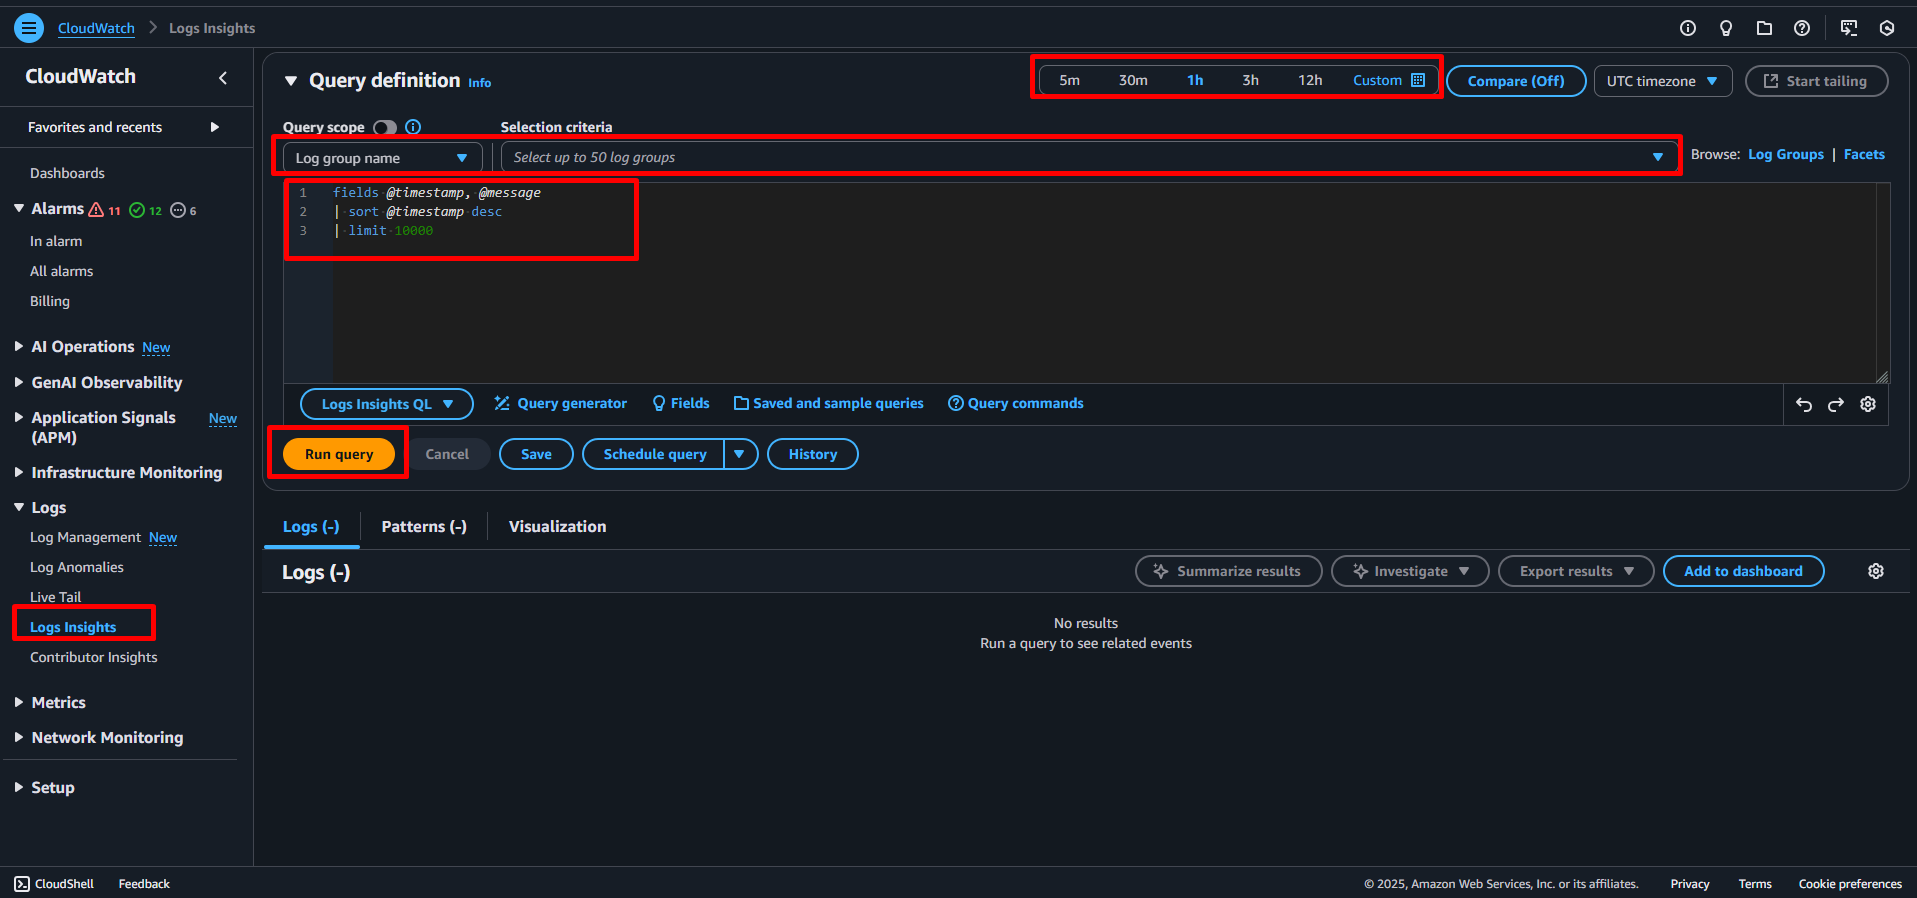
As shown in the following screenshot, five steps are needed to query log messages with CloudWatch Logs Insights.
- Open CloudWatch Logs Insights.
- Select a log group.
- Select a relative or absolute timespan.
- Type in a query.
- Press the Run query button.
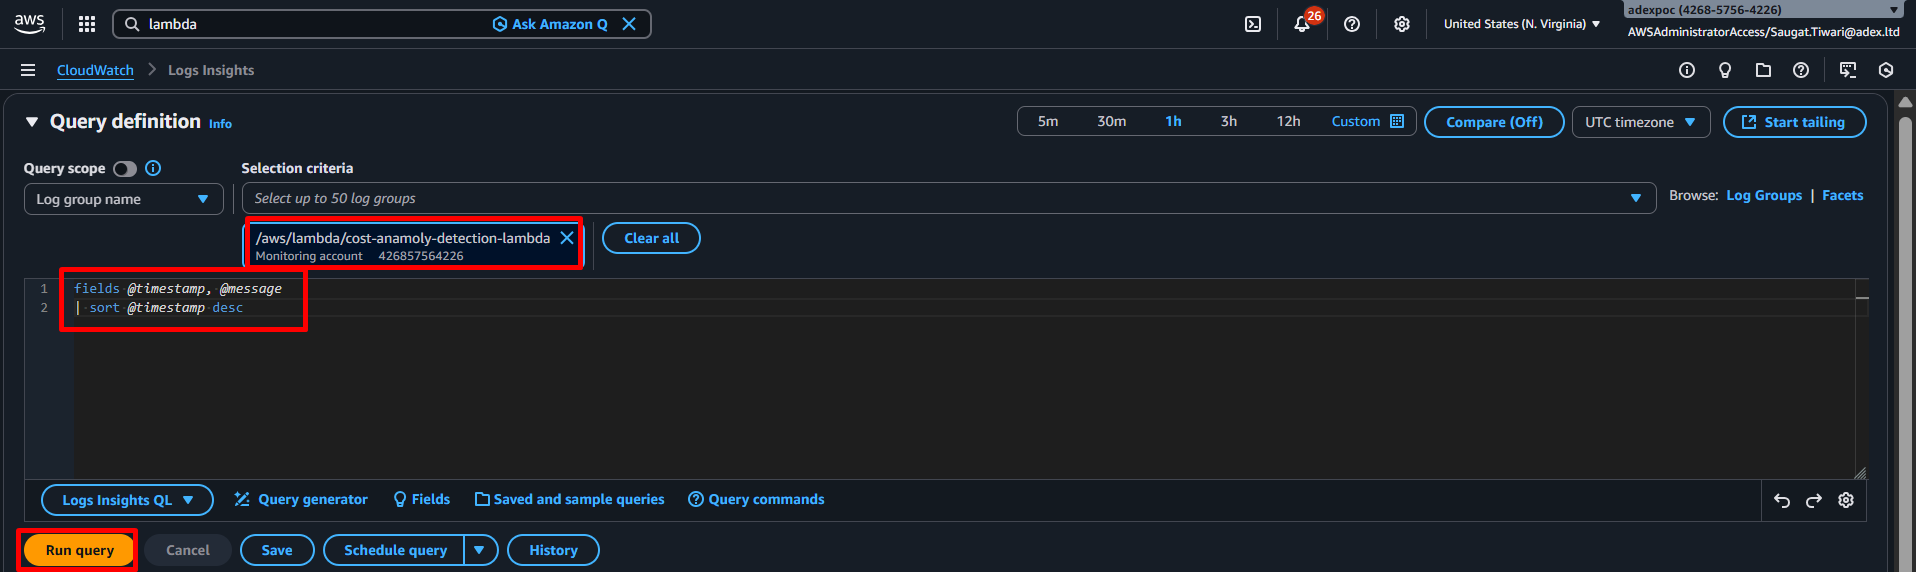
The following snippet shows a simple query which fetches all log messages and displays the fields @timestamp and @message - both default fields - sorted by @timestamp.
fields @timestamp, @message
| sort @timestamp desc
CloudWatch Logs supports both plain text messages as well as structured (JSON) messages.
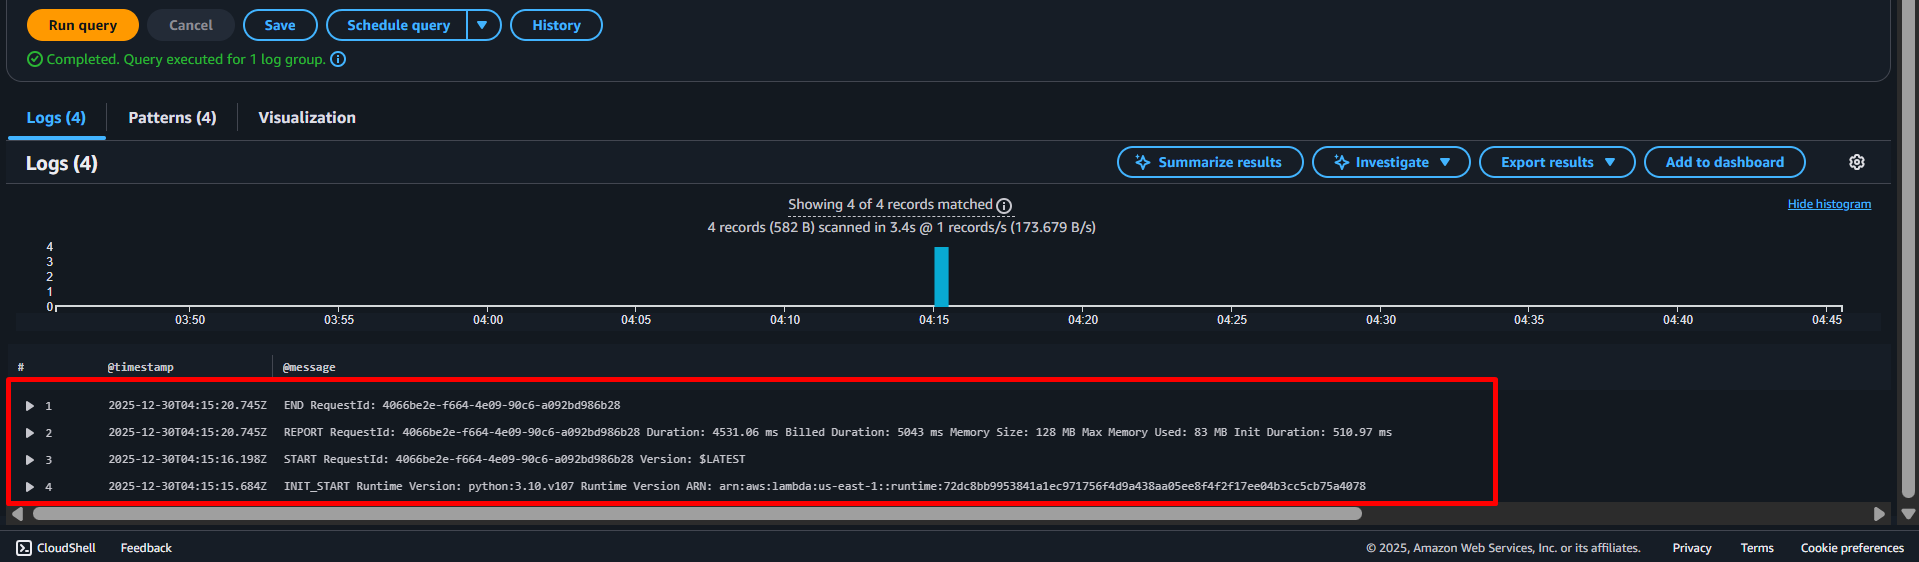
Query and parse plain text log messages
The lambda function sends plain text log messages to CloudWatch Logs. The following snippet shows a log message indicating that the lambda function initiated its runtime with python:3.10.v71 version
INIT_START Runtime Version: python:3.10.v71 Runtime Version ARN: arn:aws:lambda:us-east-1::runtime:34e014f1469e89f1bb1fdac9882b7ac87ff39a003d48ec1fd2d5b0c9f9487eb2
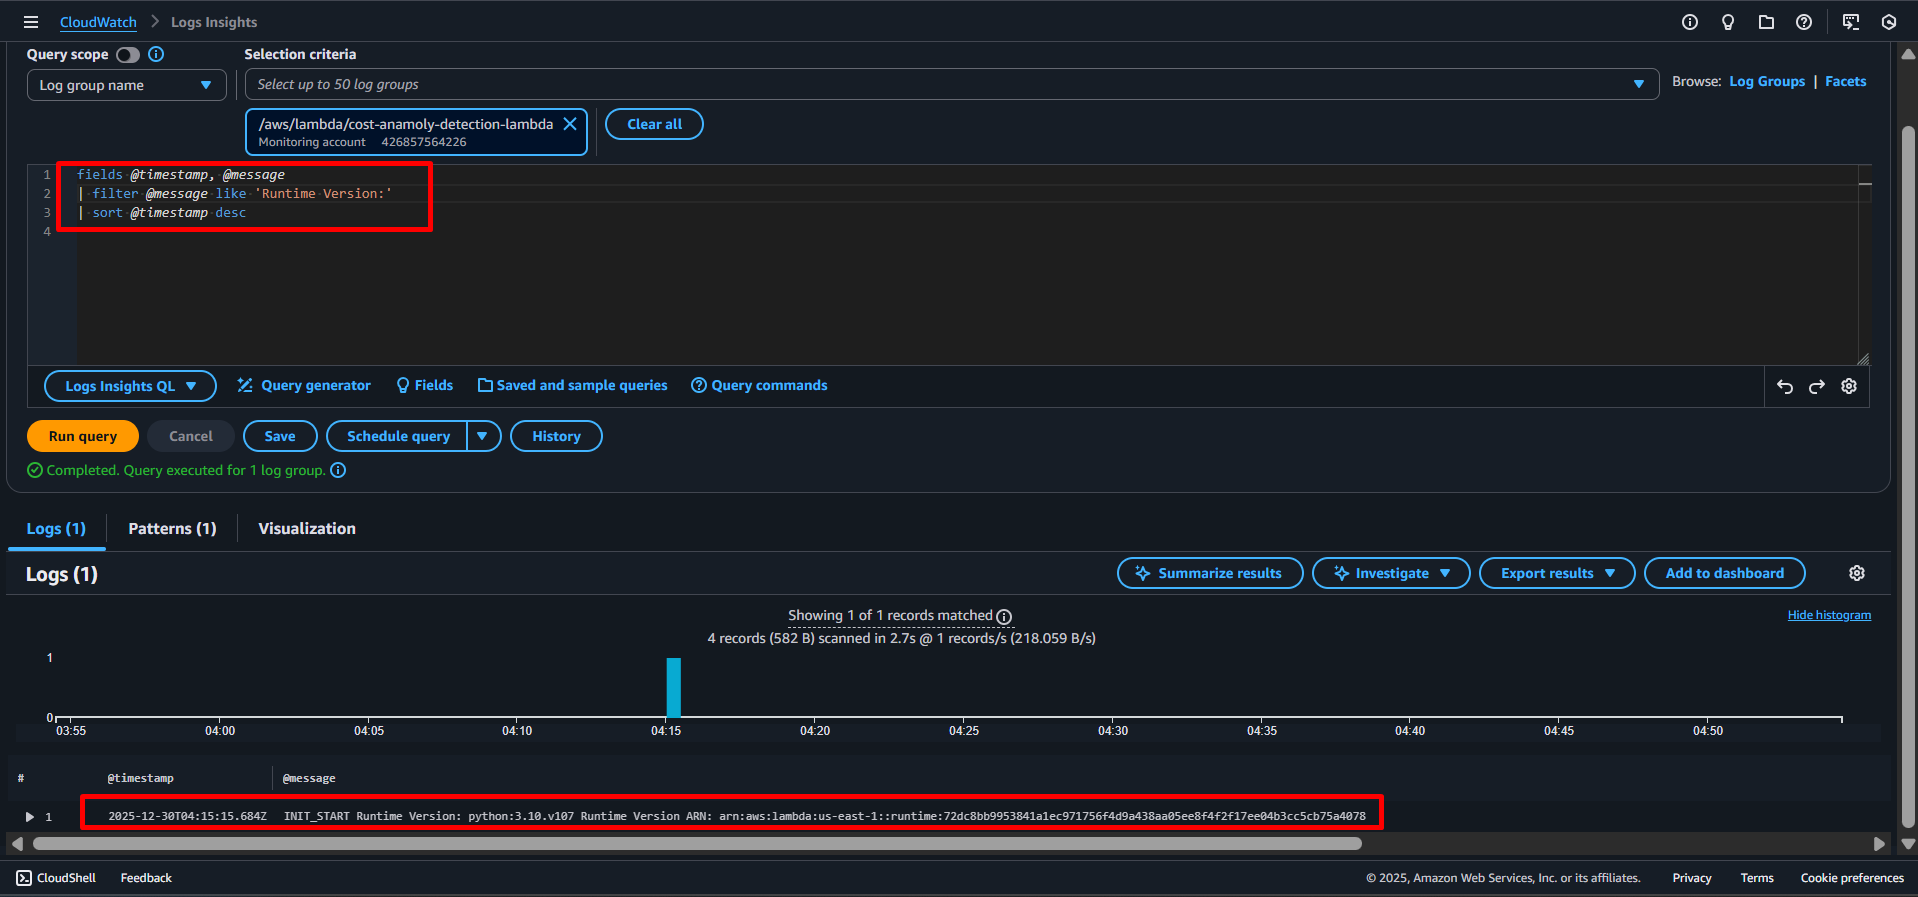
The following query filters only the log messages containing Received response..
fields @timestamp, @message
| filter @message like 'Runtime Version:'
| sort @timestamp desc
You can also use a regular expression to filter log messages, as shown in the following example.
fields @timestamp, @message
| filter @message like /INIT_START|START RequestId|END RequestId|REPORT RequestId/
| sort @timestamp desc

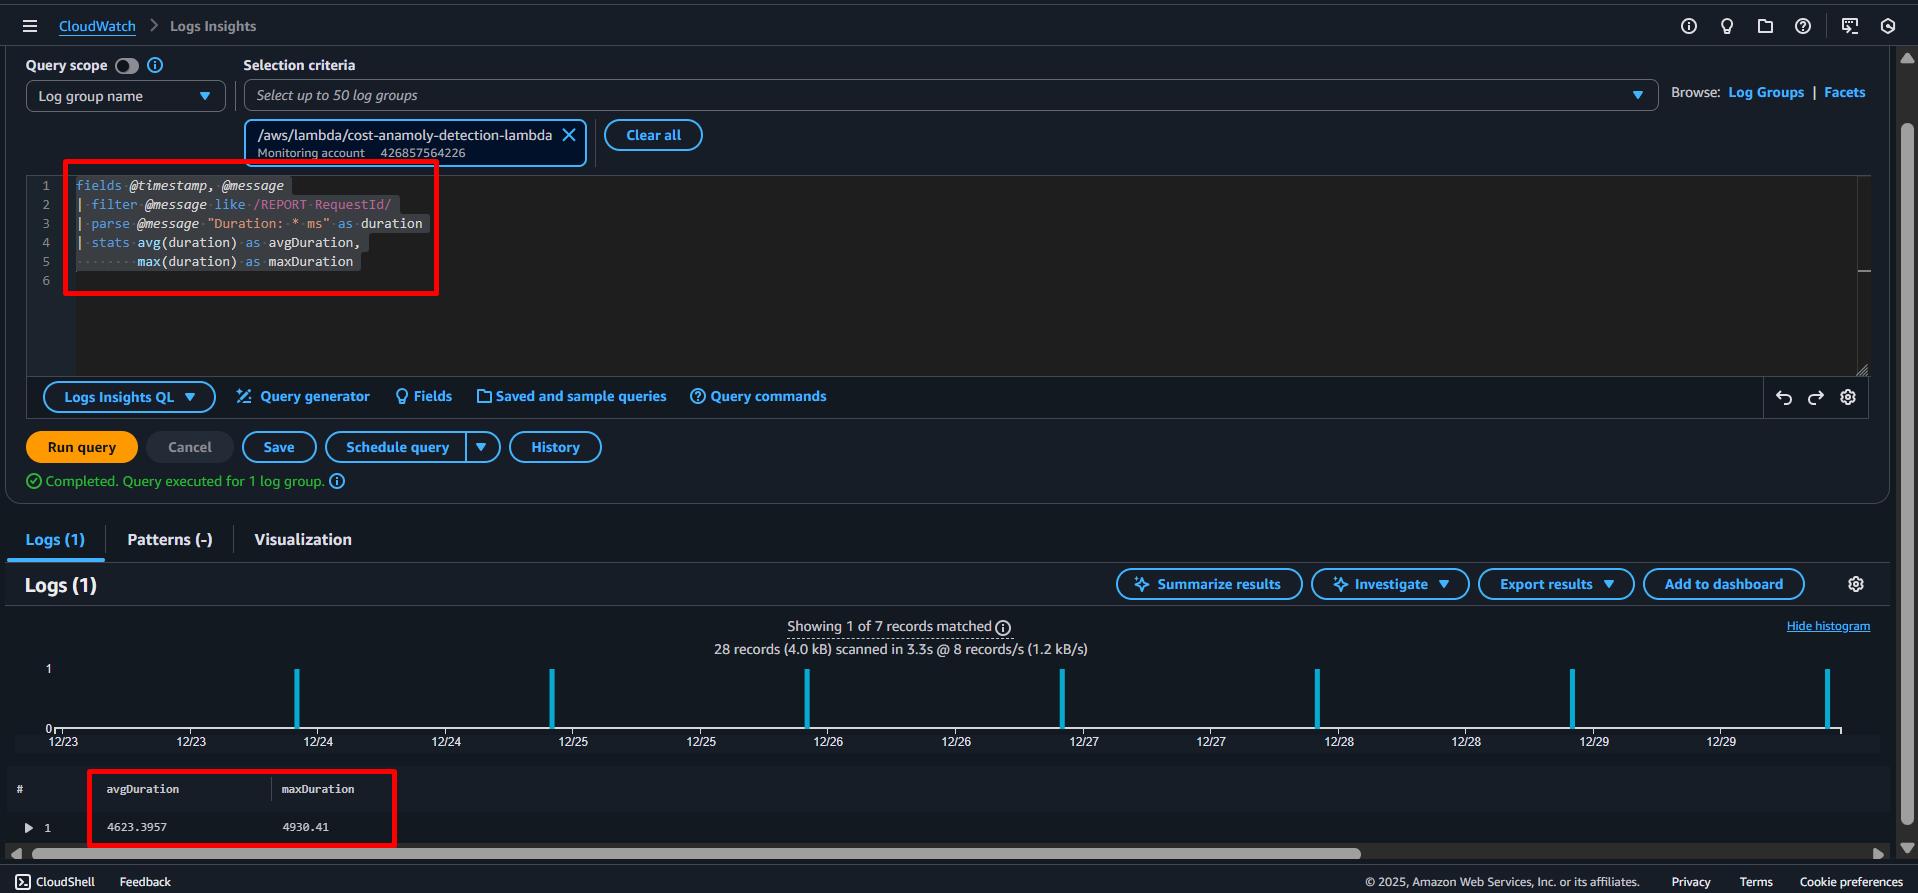
To extracts and analyse the execution duration from Lambda REPORT logs, see the following query and It then calculates the average and maximum runtime (in milliseconds) across all executions.
fields @timestamp, @message
| filter @message like /REPORT RequestId/
| parse @message "Duration: * ms" as duration
| stats avg(duration) as avgDuration,
        max(duration) as maxDuration
When you do have control over the system that produces log messages, I highly recommend sending structured log messages instead of plain text messages.
The following section shows queries for JSON log messages.
Query JSON log messages
A structured log message contains a log message as well as a JSON object with structured data.
For example, the log event consist of a message …
Processing event.
… and structured data.
{
"action":"close",
"stage":"prod"
}
Querying structured data is much simpler compared to plain text log messages — no need to write regular expressions to filter and parse data.
The following query filters log messages based on the fields action and stage, both parsed by CloudWatch Logs automatically.
fields @timestamp, @message
| filter action = 'close' and stage = 'prod'
| sort @timestamp desc
It is helpful to sort the log messages by the stream as well. Because otherwise log messages from different Lambda invocations, EC2 instances, … will show up together.
fields @timestamp, @message
| sort @logStream, @timestamp desc
Scrolling through endless lines of log messages is not very helpful when debugging. Luckily, you can even visualize log messages with CloudWatch Logs Insights.
How to visualize logs?
The following query creates two statistics to visualize the billed duration of Lambda function invocations: sum the sum of the duration of all invocations, as well as the 95 percentile (pct) the duration of all invocations. The data is grouped into 5-minute buckets.
Use the query on any log group of a Lambda function.
fields @timestamp, @message
| stats sum(@billedDuration), pct(@billedDuration, 95) by bin(5m)
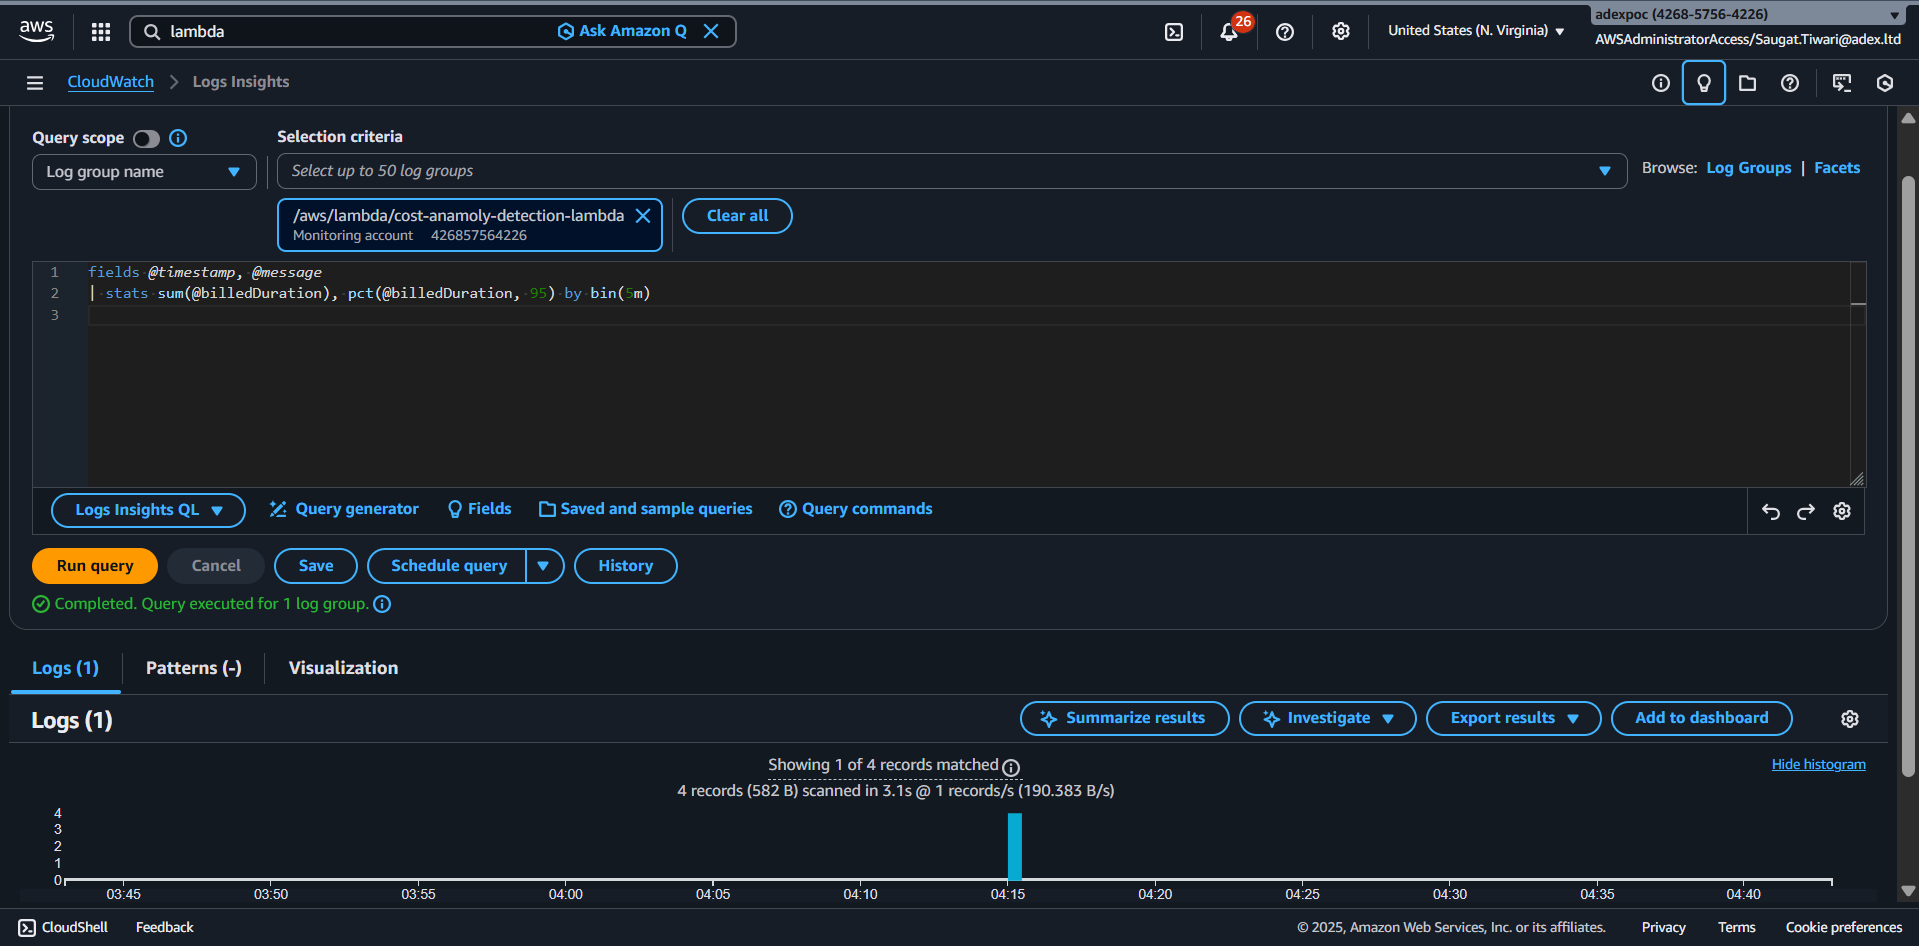
fig: this image illustrates the result of the visualized query.
Visualizing logs is also possible with plain text log messages.
You already got to know the log message of lambda function execution.
INIT_START Runtime Version: python:3.10.v71 Runtime Version ARN: arn:aws:lambda:us-east-1::runtime:34e014f1469e89f1bb1fdac9882b7ac87ff39a003d48ec1fd2d5b0c9f9487eb2
The following query creates a visualization of lambda execution duration from Lambda REPORT logs and groups invocations into 15-minute windows.
For each window, it shows the total runs and the 95th-percentile execution time.
fields @timestamp, @message, @duration
| filter @message like /REPORT RequestId/
| parse @message "Duration: * ms" as duration
| stats count(*) as invocations,
        pct(duration, 95) as p95Duration
by bin(15m)
Limitations
Compared to other solutions like Elastic Stack (Elasticsearch + Kibana), Loggly, Splunk, and Sumo Logic, CloudWatch Logs Insights has a few limitations:
- A query cannot analyze data from multiple log groups.
- The ability to visualize data is limited.
Summary
The query and visualization capabilities of Insights have upgraded CloudWatch Logs substantially. The fact that CloudWatch Logs and Insights is billed per usage (storage, data ingestion, analyzed data) is a huge benefit.
Stay tuned for more. Let’s connect on Linkedin and explore my GitHub for future insights.